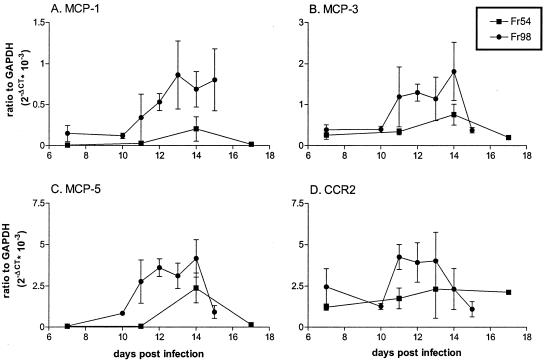
FIG. 5.
Kinetic analysis of mRNA expression of MCP-1 (A), MCP-3 (B), MCP-5 (C), and CCR2 (D) in Fr54- or Fr98-infected IRW mice. mRNA expression was determined using real-time PCR. Data are shown as the average difference of the gene of interest relative to GAPDH mRNA expression on a linear scale (2−ΔCT). The data are presented as the average for two to four mice per time point for Fr54 and three to seven mice per time point for Fr98; error bars indicate standard error.

