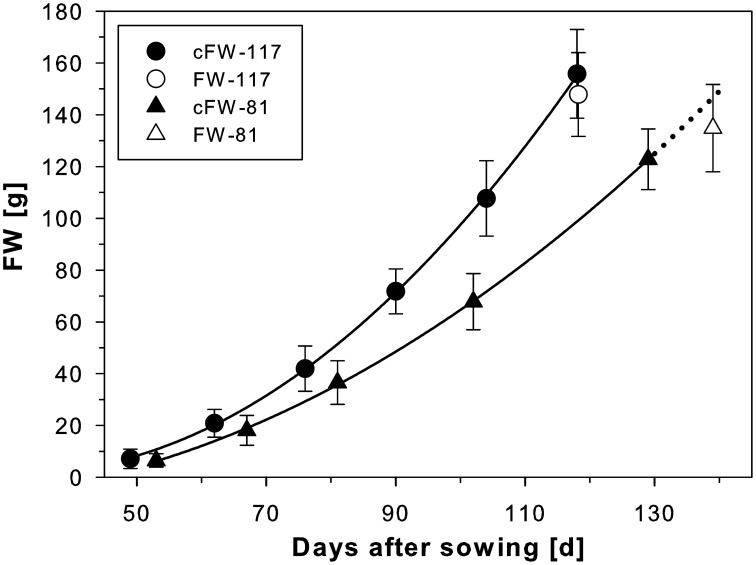
Figure 3.
Development of sugar beets grown in containers with either 117 mm I.D. (800 mm in height; cf. Figure 1) or 81 mm I.D. (400 mm in height; cf. Figure 2) for which calculated fresh weights of the beets (cFW-117 and cFW-81) were derived from MRI measurements every second week. A polynomial of 2nd order was fitted to the data points (for both R2 = 0.9998). The fresh weight of the beets in the large containers was taken after harvest following the respective last MRI measurement at 118 DAS (FW-117). For the small containers, the cFW-81 curve beyond 129 DAS (dotted line) was extrapolated based on the polynomial for comparison with the fresh weight taken at slightly delayed harvest on 139 DAS (FW-81). The MRI measurements used the same MRI sequences and parameters as of Figure 1B. The values and error bars are given as arithmetic mean ± SD (n = 8 plants, respectively).

