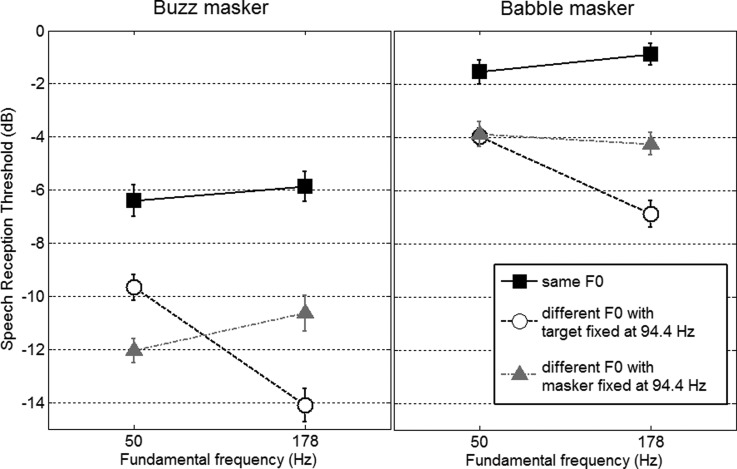
FIG. 2.
Mean speech reception threshold measured for a voice against a buzz (left panel) or against a babble (right panel). Target and masker either shared the same F0, at 50 and 178.2 Hz, or had F0s that were ±11 semitones apart in all possible configurations. Error bars are ±1 standard error of the mean over 18 listeners.

