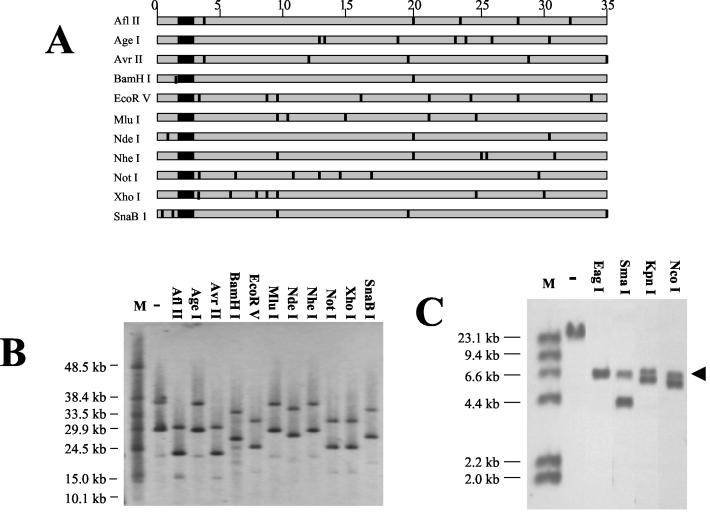
FIG. 4.
Restriction enzyme digestion of HDEP genome. (A) Schematic representation of Ad5.1FGF-4 genome with approximate positions of restriction enzyme sites in the genome. The large black square represents the FGF-4 cDNA region. DNA size (in kilobases) is listed above in steps of 5 kb. (B) A sample containing both HDEP and Ad5.1FGF-4 was loaded on a FIGE gel either uncut (−) or cut with a panel of restriction enzymes as listed. All chosen enzymes had no recognition sites in pIG.E1A.E1B. Lane M, molecular weight markers. The blot was probed with the same E1A probe that was used for Fig. 3A. (C) A sample containing both HDEP and Ad5.1FGF-4 was loaded on a 1% agarose gel either uncut (−) or cut with restriction enzymes as listed. All chosen enzymes had only one recognition site in pIG.E1A.E1B. The blot was probed with the same E1A probe as that used for Fig. 3A. The black arrow denotes a common 7-kb hybridizing fragment.

