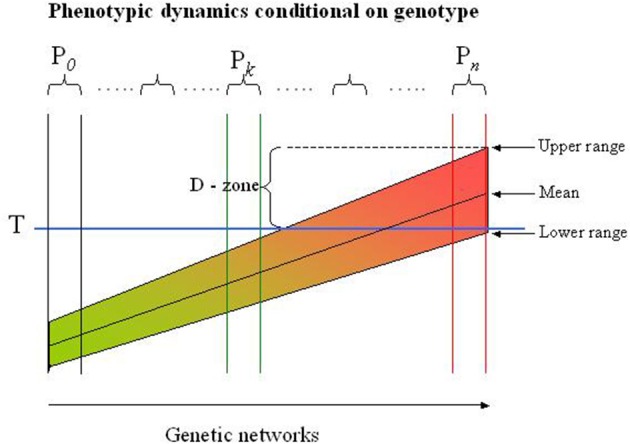
Figure 1.

Risk profile in genetic networks. The population in this example is partitioned into more homogeneous subpopulations (Pi) by the LCA-SEM procedure indicated by the sets of two vertical lines. Each subpopulation is genetically defined by an ensemble of networks with exactly the same topology but differs in genetic variations. The networks in each subpopulation arise by successive mutational incidences that are balanced (buffered) to generate a phenotype similar for all subjects in the subpopulation (see also the text). In reality the subpopulations represent different local maxima in a miltidimensional phenotypic landscape, but are for illustrative purposes collapsed to flat, two-dimensional presentation. The range of the phenotype (e.g., diastolic blood pressure) depends on extra-genetic factors, but can never exceed the range defined by the genotype. Thus, some subjects (genotypes) will never exceed the threshold (T), while others will experience the extreme phenotype (e.g., diastolic hypertension) regardless of extra-genetic factors. The D(anger) - zone indicates the subjects or subpopulations which may be classified in this examples as diastolic hypertensive. However, this may depend on the circumstances under which the blood pressure is measured, i.e., subjects may be classified as normotensive although they have a massive propensity to develop hypertension. Dichotomizing the trait in a population is thus a dubious affaire and compromise most association studies to the point that information of the genetics of, in this case diastolic blood pressure, is entirely lost.
