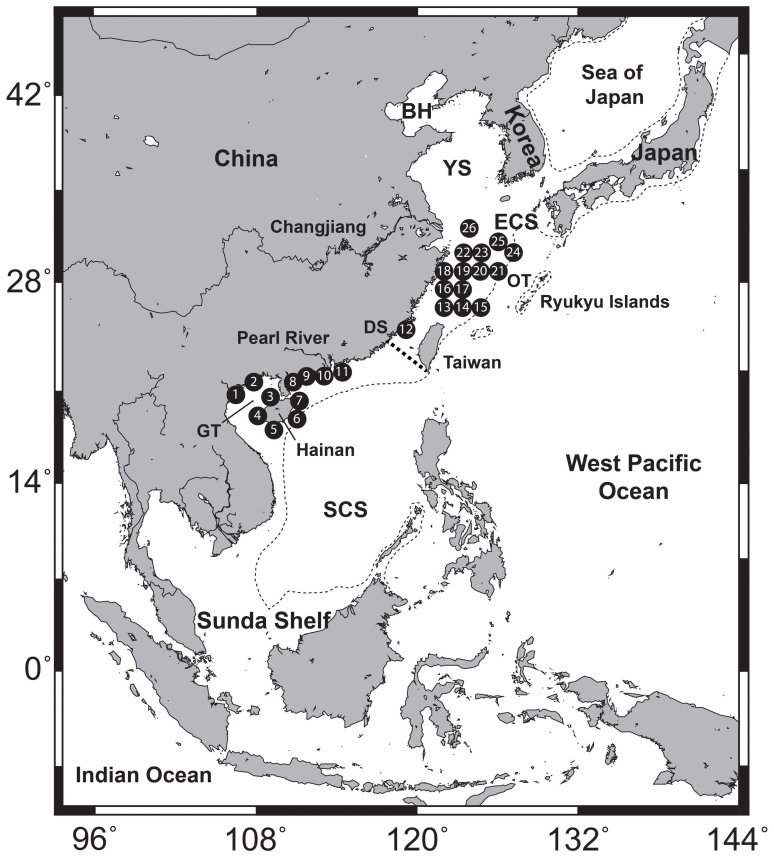
Figure 1. Map of the East China and northern South China Seas from which individuals of Trichiurus japonicus and T. nanhaiensis were sampled for this study.
Individual sampling sites are listed in Table 1. The shoreline of the LGM (−130 m) is indicated by thin dashed line and the boundary of the East China Sea and South China Sea is indicated by thick dashed line. BH = Bohai Sea, YS = Yellow Sea, ECS = East China Sea, SCS = South China Sea, OT = Okinawa Trough, DS = Dongshan, GT = Gulf of Tonkin. Map was created in software Generic Mapping Tools (GMT v3.1.1; http://gmt.soest.hawaii.edu/).

