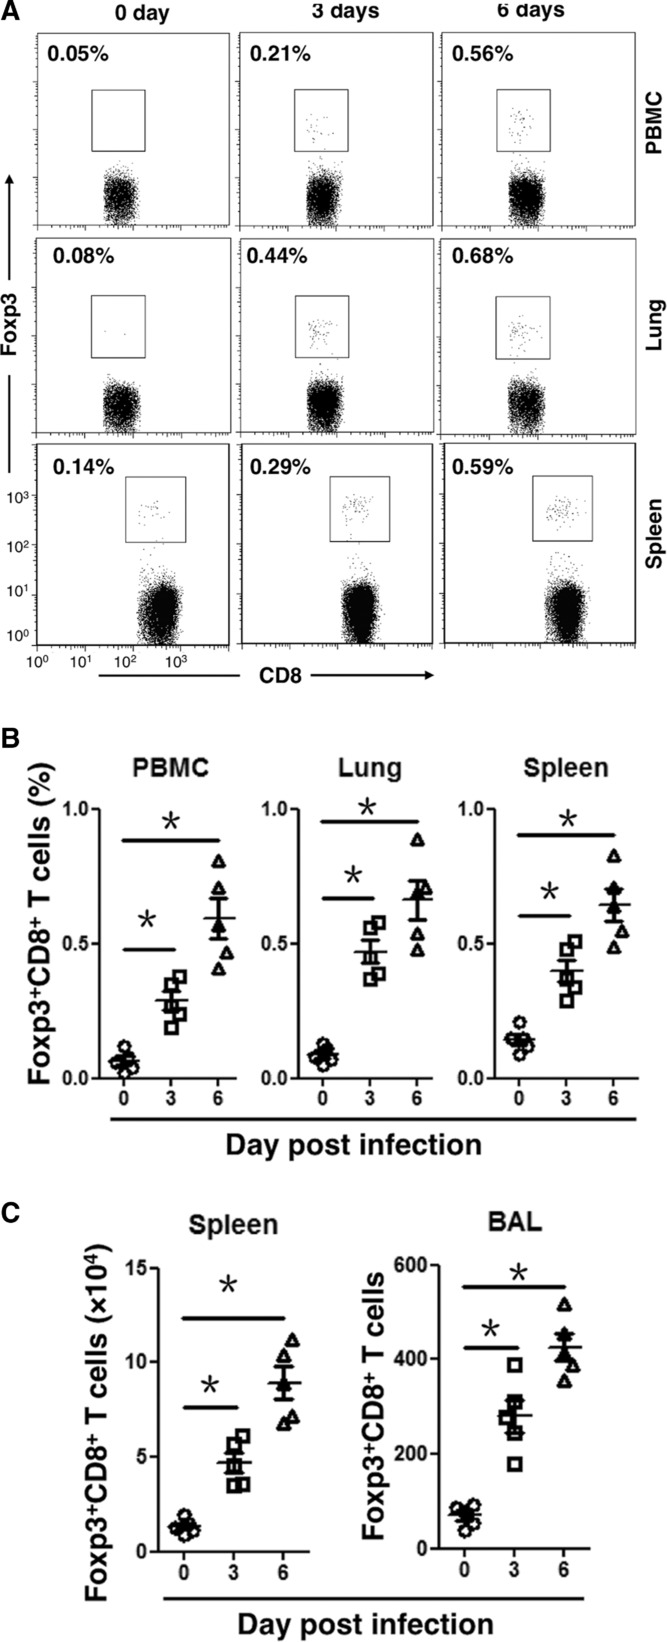
Figure 1.

Induction of CD8+ Treg cells in Foxp3-GFPtg mice during H5N1 viral infection. (A) Surface staining of CD8 on the PBMCs, lung cells, and spleen cells taken from Foxp3-GFPtg mice on days 0, 3, and 6 after infection with H5N1 virus. The dot plots represent one of three independent experiments with similar results (n = 5 mice). (B) Statistical analysis of Foxp3+ cells in total CD8+ T cells (%). (C) Surface staining of CD8 on the spleen and BAL cells taken on days 0, 3, and 6 from Foxp3-GFPtg mice infected with H5N1 virus. The number of CD8+Foxp3+ T cells is shown (n = 5 mice). (B and C) Data are from one experiment representative of three separate experiments. *p < 0.05, unpaired two-tailed t-test.
