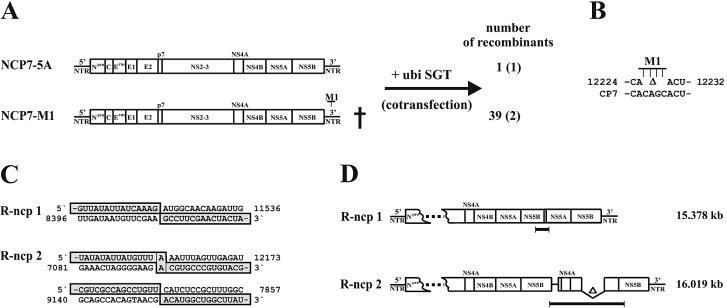
FIG. 4.
RNA recombination between two synthetic transcripts. (A) Schematic representation of NCP7-5A and its derivative NCP7-M1. The cross indicates the noninfectious nature of NCP-7-M1. The number of recombinants produced after cotransfection of cells with +ubi SGT (see Fig. 1A) and RNA of NCP7-5A or NCP7-M1 are indicated. Numbers in parentheses show the numbers of independent experiments. (B) Comparison of partial nucleotide sequences of NCP7-M1 (top) encompassing the genetic marker M1 (deletion of four nucleotides within the 3′ NTR) and CP7 (bottom). Numbering refers to the sequence of CP7-5A. (C) Crossover regions of two selected noncp recombinants (R-ncp 1 and R-ncp 2). Both emerged after recombination between the RNAs of NCP7-M1 and +ubi SGT. The respective sequences of the recombination partners NCP7-M1 (top) and +ubi SGT (bottom) and the recombinant sequences (gray boxes) are indicated. Numbering refers to the CP7-5A sequence. Note that a single crossover region was found within the analyzed region of R-ncp 1, whereas two crossover regions are present in the genome of R-ncp 2. (D) Genome organizations and calculated lengths of R-ncp 1 (top) and R-ncp 2 (bottom). The bars are not drawn to scale. The underlined parts of the genomes have been sequenced.

