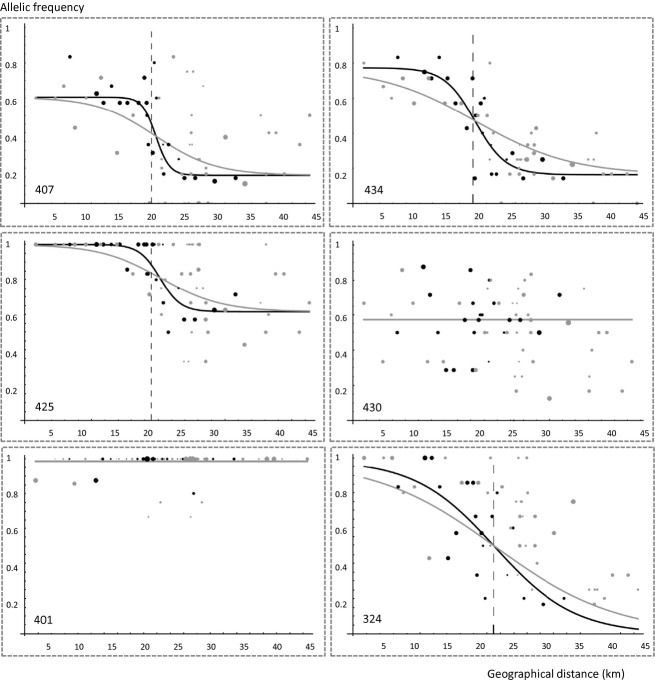
Figure 3.
Change in neutral genetic clines for six of the 15 microsatellites considered between the two sampling dates. From top to bottom and left to right, the loci represented are MfSSR-407, 434, 425, 430, 401 and 324. Allelic frequencies at T1 (black) and T2 (grey) are plotted against distance along the main axis of the cline. Distances are given in km, 0 being the southernmost site. Dots represent sampling sites, dot size being proportional to the number of individuals sampled. Curves show the fitted clines (scaled Logit shapes), with their centres highlighted through dashed vertical lines.

