
Fig. 6.
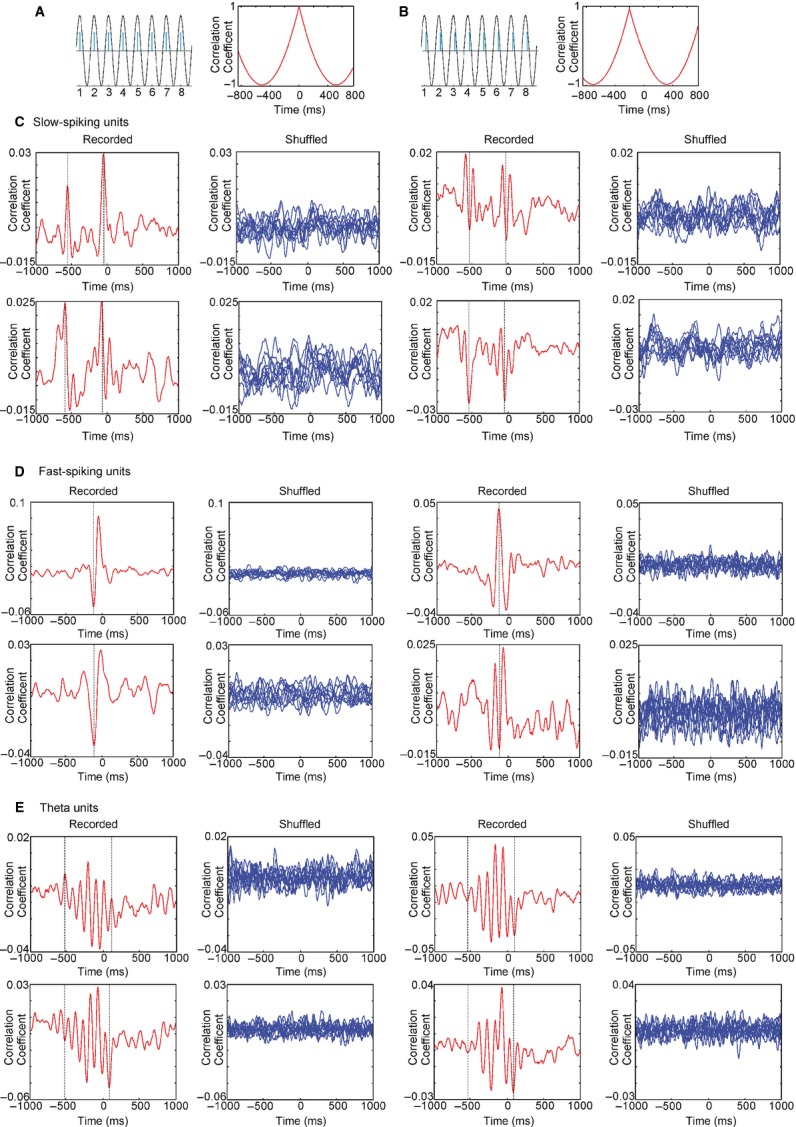
Phase relationship between septal cell types and sniff cycle. (A) Inter-spike correlation between sinusoid oscillation (black) and modelled spikes (blue) when the oscillation and spikes are in-phase. Cross-correlogram example (right panel) shows the peak of correlation at time 0. (B) Cross-correlogram example for phase-shifted spikes shows the peak of correlation in the negative part of the x-axis, left from time 0 (right panel). (C) Sample cross-correlograms of recorded (red, left) and shuffled (blue, right) spikes from four slow-spiking units. Dashed lines on each panel represent positive/negative correlation peaks. (D) Sample cross-correlograms of recorded (red, left) and shuffled (blue, right) spikes from four fast-spiking units. The dashed line on each panel represents a time lag of −100. (E) Sample cross-correlograms of recorded (red, left) and shuffled (blue, right) spikes from four theta units. Dashed lines represent a time lag of +100 (right line) and −550 (left line).