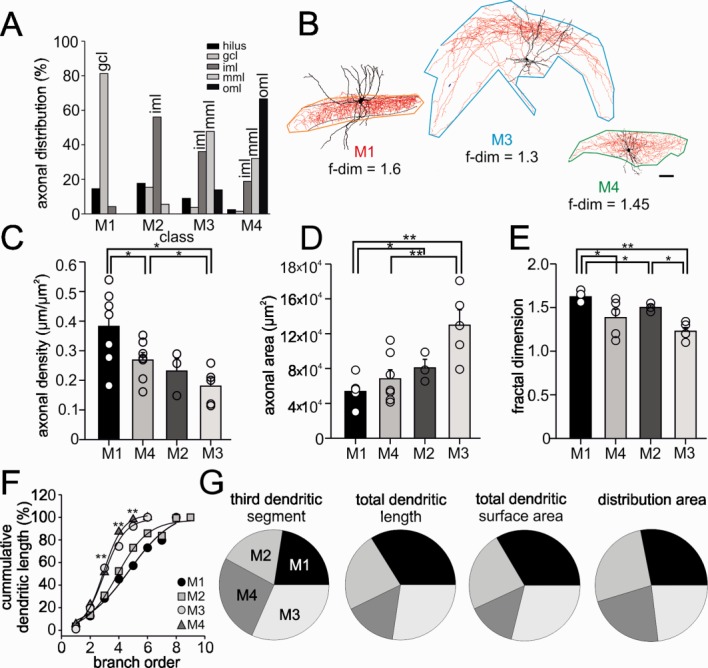
FIGURE 3.

Interneuron classes differ in their axonal and dendritic characteristics. (A) Percental distribution of axonal projections within defined layers of the dentate gyrus and hilus and CA3 derived from reconstructed interneurons. Class M1 cells (n = 7) show axon distributions largely in the granule cell layer (gcl), class M2 cells (n = 3) in the inner molecular layer (iml), class M3 neurons (n = 5) in the inner and middle molecular layer (iml, mml) and class M4 cells (n = 7) distribute axon collaterals in the middle and outer molecular layer (mml, oml). (B) Morphological neurolucida reconstructions of representative neurons belonging to class M1, M3, and M4. Lines surrounding neurons show how tiles were defined to determine the fractal dimensionality (f-dim) and density of the projected axon. Numbers represent f-dim values of the three shown representative cells. Scale bar, 50 µm. (C–E) Graphs summarize average axonal density (C), axonal area (D) and fractal dimension of the axon (E). Axonal density was determined by dividing total axonal length by the tile area. (F,G) Interneuron classes express differences in dendritic properties. (F) Cumulative dendritic distribution of interneuron classes in dependence on branch order. Note larger cumulative dendritic length between the 3rd and 5th branch order for class M3 and M4 neurons. (G) Pie charts represent differences in the length of the third order dendritic segment, the total dendritic length, the total dendritic surface area and the distribution area of dendrites among interneuron M classes (100% refers to the sum of the mean values from all M classes). (*, P < 0.05; **, P < 0.01; see also Supporting Information Tables 3 and 4).
