FIGURE 1.

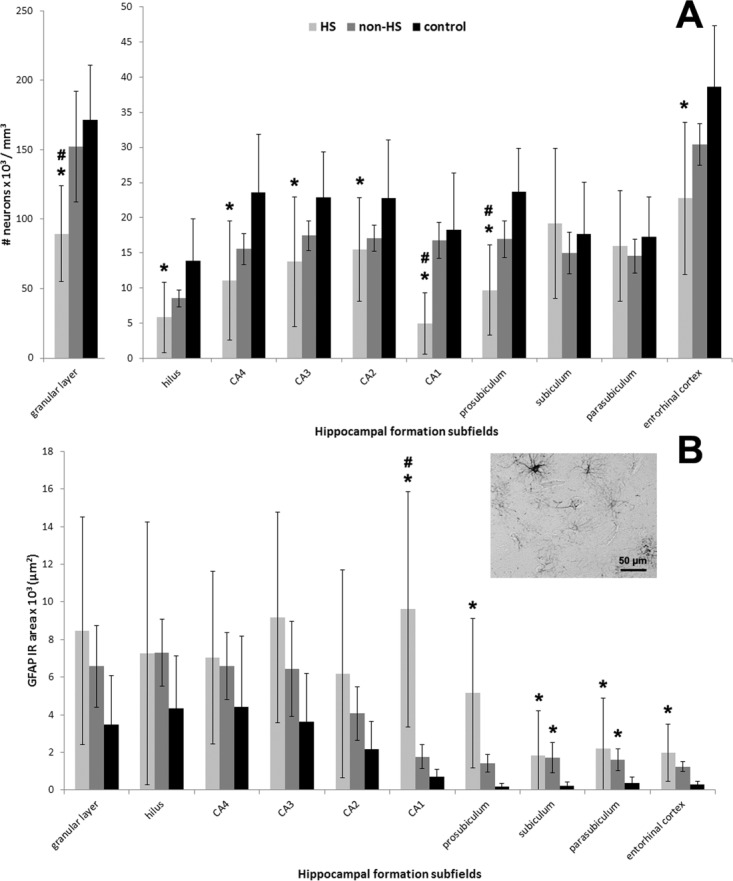
Neuronal density and GFAP expression in human hippocampal formation subfields. Neuronal density and GFAP IR area values from HS (light gray bars), non-HS (gray bars), and non-epileptic controls (black bars) are indicated as mean ± std. deviation. Asterisk indicate significant statistical difference (P < 0.05) between epileptic and control group. Hash sign indicate significant statistical difference (P < 0.05) between epileptic groups. (A) Neuronal loss (based on Neu-N positive cell count) in HS hippocampi was identified in the dentate gyrus (granular layer and hilus), Ammon∼s horn subfields (CA1-CA4) and prosubiculum when compared to controls. The pattern of neuronal loss followed classical HS description: maximum reduction in CA1 (73%) but also severe (41–59%) in granular layer/hilus/CA4/prosubiculum/entorhinal cortex, with relative preservation of CA2 and CA3 (32–40%). Neuronal density in the subiculum and parasubiculum was similar between the groups. HS granular layer, CA1, and prosubiculum exhibited lower neuronal density than non-HS (hash signs). (B) GFAP IR area measured in the HS hippocampal formation showed increased expression from CA1 to entorhinal cortex when compared to the other groups. In HS CA1, GFAP-IR area was higher than in non-HS. Non-HS hippocampal formation showed astrogliosis in subiculum and parasubiculum as compared to controls. Excerpt on the right illustrates the GFAP-IR pattern seen in HS entorhinal cortex, with ramificated astrocytes and negative stained neuronal nuclei.
