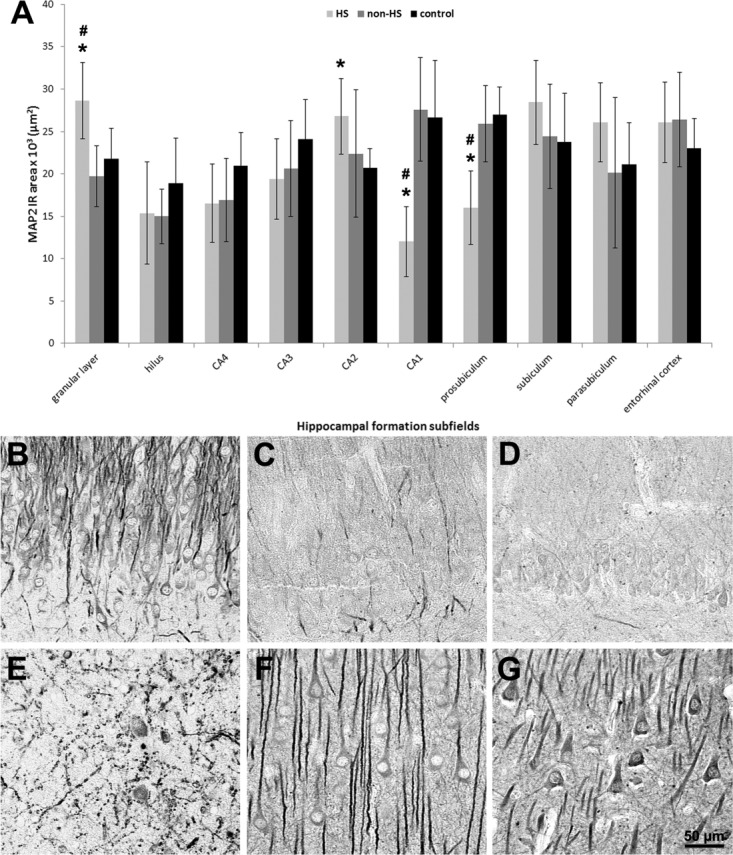
FIGURE 3.

MAP2 immunohistochemical expression in human hippocampal formation. (A) Quantification of MAP2 IR area in hippocampal formation subfields of HS (light gray bars), non-HS (gray bars), and control group (black bars). MAP2 expression was increased in the granular layer and CA2 of HS and decreased in CA1 and prosubiculum as compared to controls. HS granular layer, CA1, and prosubiculum also differed from non-HS cases. Values indicated as mean ± std. deviation. Asterisk indicate significant statistical difference (P < 0.05) between epileptic and control group. Hash sign indicate significant statistical difference (P < 0.05) between epileptic groups. (B–D) In HS granular layer (B), increased MAP2 IR was conspicuous in dendrites and cytoplasm of granular cells, as compared to non-HS (C) and control (D). (E-G) In HS CA1 (E), MAP2 positive staining was seen in abnormally shaped neurons and dendrites, in contrast to the elongated fiber pattern of pyramidal cells in non-HS (F) and control (G).
