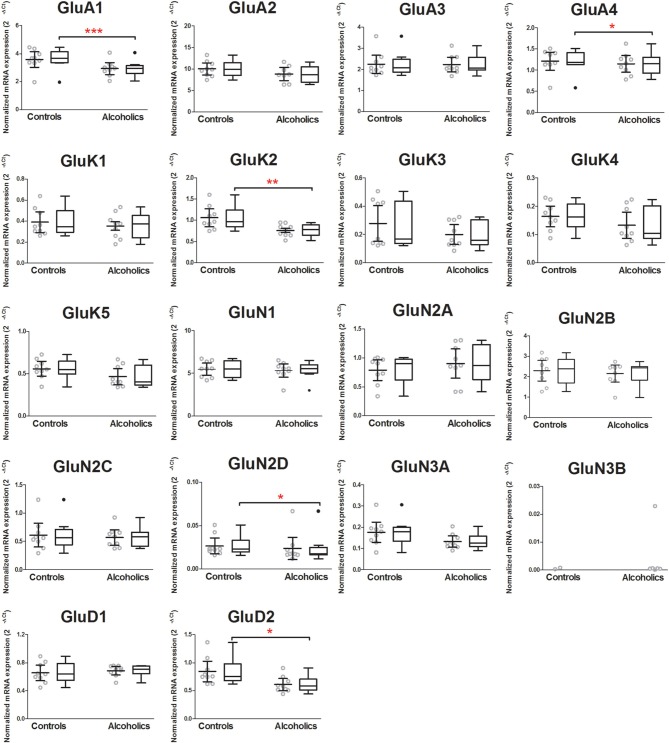
Figure 2.
Expression of ionotropic glutamate receptor subunits mRNAs in the central amygdala of controls (n = 9) and alcoholics (n = 9). Data from each group were presented as scatter dot plot (◦) with mean and 95% confidence interval and box and whiskers plot with median and whiskers plotted by Tukey method to determine outliers (•–above or below the whiskers). Outliers were excluded from the statistical analysis. One-Way ANOVA with Bonferroni post-hoc test: GluA1, df = 14, p = 0.00023; GluA2, df = 14, p = 0.15; GluA3, df = 14, p = 0.32; GluA4, df = 14, p = 0.04; GluK1, df = 14, p = 0.27; GluK2, df = 14, p = 0.0078; GluK4, df = 14, p = 0.22; GluK5, df = 14, p = 0.068; GluN1, df = 14, p = 0.99; GluN2A, df = 14, p = 0.38; GluN2B, df = 14, p = 0.43; GluN2C, df = 14, p = 0.76; GluN3A, df = 14, p = 0.12; GluD1, df = 14, p = 0.45. Kruskal–Wallis ANOVA on ranks with Dunn's post-hoc test: GluK3, H(1, 18) = 1.22, p = 0.27; GluN2D, H(1, 17) = 4.08, p = 0.043; GluD2, H(1, 18) = 5.9, p = 0.015. *p < 0.05; **p < 0.01; ***p < 0.001.

