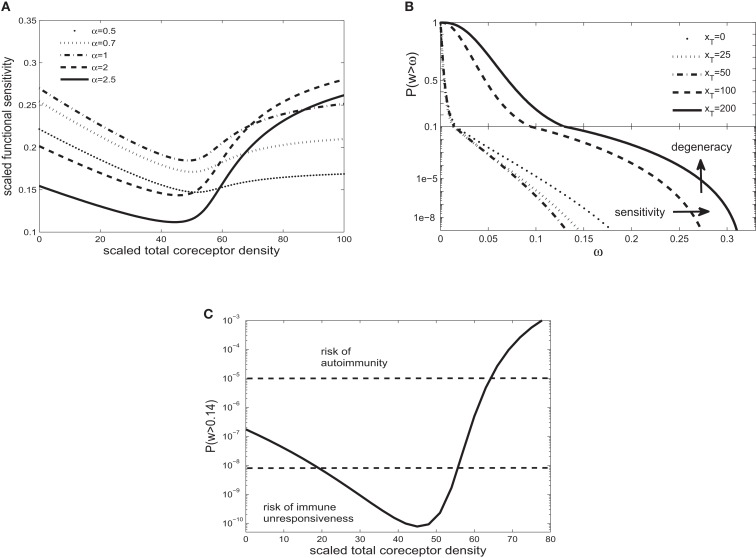
Figure 2.
(A) Scaled functional sensitivity w as a function of scaled total CD8 density xT for various scaled TCR/pMHCI off-rates α. (B) Degeneracy curves ℙ(w > ω) for various scaled total CD8 density xT. (C) The probability ℙ(w > ω) as a function of CD8 density xT, at a set value of functional sensitivity ω = 0.14. The operating range of the probability ℙ is shown as a function of xT with dashed lines at ℙ(w > 0.14) = 10−8 and ℙ(w > 0.14) = 10−5. Parameters are as follows: . The log-normal distribution has mean 2 and SD 0.2. Changed: ω = 0.14, γkin, γR,κ and α’s in (A).

