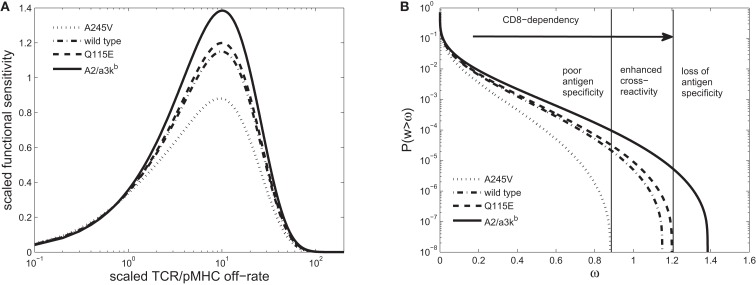
Figure 5.
(A) Scaled functional sensitivity w as a function of scaled TCR/pMHCI off-rate α. (B) Degeneracy curves ℙ(w > ω) for HLA A*0201 mutants with altered binding affinity for CD8: A245V (dotted line), wild-type (semi-dashed line), Q115E (dashed line), and A2/α3kb (solid line). The three regions represent the overall pattern of CD8+ T-cell antigen specificity and the arrow indicates the strength of pMHCI/CD8 interaction. Wild-type parameters are as follows: δ = 0.2, n = 100, γkin = 0. 5, γoff = 0. 5, γR = 0. 2, κ = 1, mT = 10, rT = 10, xT = 10; the parameter δ is adjusted in proportion to the ratio between the mutant pMHCI/CD8 affinity constant (i.e., dissociation constant) and the wild-type affinity, whereas the parameters κ and xT are adjusted in inverse proportion to the mutant/wild-type pMHCI/CD8 affinity (these adjustments follow from the scaling). The log-normal distribution has mean 5 and SD 0.5. Figure 5C has been deleted.

