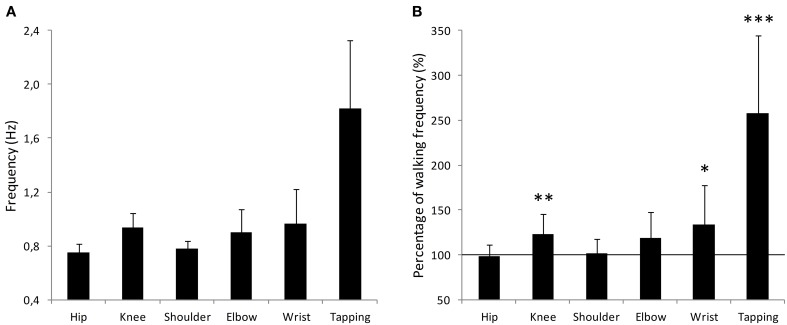
Figure 2.
Comparison between the six movements performed during the experiment. (A) Mean frequency (Hz) for each movement. Movements are referred to as their corresponding joint. Error bars represent standard error. (B) Each movement frequency is represented relative to the mean walking frequency for each participant, corresponding to the value 100%. Error bars represent standard error. *p < 0.05, **p < 0.01, ***p < 0.001.

