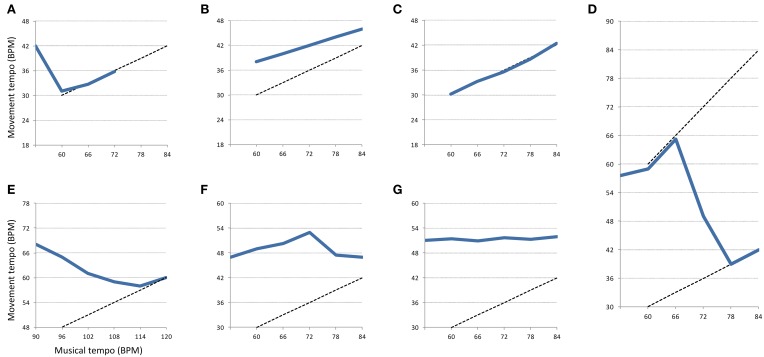
Figure 3.
Examples of behavioral patterns found in the experiment. Thick blue lines represent the evolution of the movement tempo from segment to segment. Dotted lines represent a perfect match between musical and movement tempo according to a certain metrical level. The represented patterns are the following: (A) Start Adaptation, (B) Acceleration, (C) Synchronization, (D) Metrical Change, (E) Adaptation, (F) Limit Reached, (G) Stable. The pattern “No Disruption” is not represented here because it corresponds to a flat line during the whole experiment.

