
Figure 2.
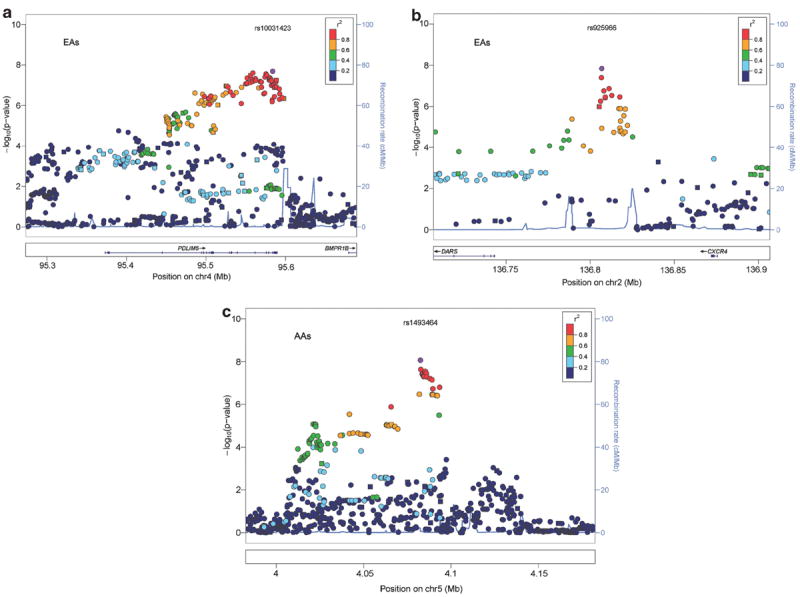
(a) Chromosome 2 regional Manhattan plot in European-Americans: regional Manhattan plot for the 136.70–136.90 MB region on chromosome 2 showing the adjusted symptom count meta-analysis P-values from EAs in the discovery sample. The points are colored based on the LD with rs925966. Square points indicate genotyped SNPs and round points indicate imputed SNPs. Data include the GCD sample plus SAGE. (b) Chromosome 4 PDLIM5 region in EAs: regional Manhattan plot for the 95.27–95.69 MB region containing PDLIM5 on chromosome 4 showing the adjusted symptom count meta-analysis P-values from EAs in the discovery sample. The points are colored based on the LD with rs10031423. Square points indicate genotyped SNPs and round points indicate imputed SNPs. Data include the GCD sample plus SAGE. (c) Chromosome 5 regional Manhattan plot in African-Americans: regional Manhattan plot for the 3.98–4.18 MB region on chromosome 5 showing the adjusted symptom count meta-analysis P-values from AAs in the discovery sample. The points are colored based on degree of LD with rs1493464. Square points indicate genotyped SNPs and round points indicate imputed SNPs. Data include the GCD sample plus SAGE. AA, African-American; EA, European-American; LD, linkage disequilibrium; SAGE, study of addiction: genetics and environment.