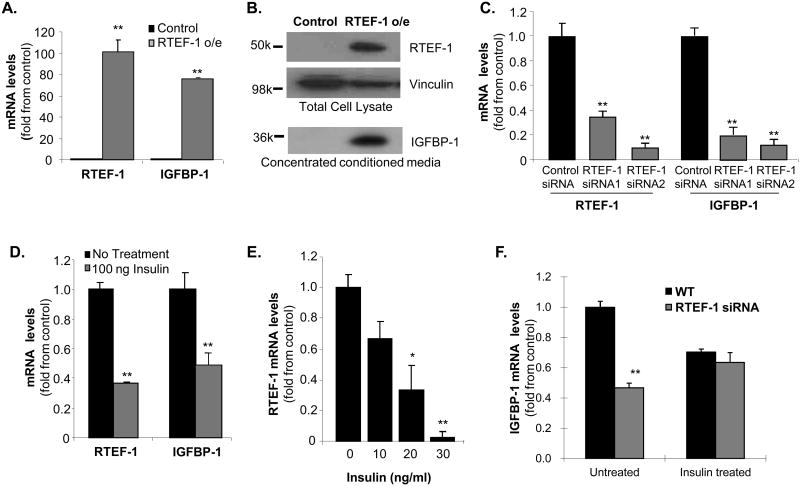
Figure 4. RTEF-1 is required for IGFBP-1 gene expression in endothelial cells.
A. Quantitative real time PCR (QPCR) analysis of IGFBP-1 mRNA levels in HMEC-1 cells o/e RTEF-1. IGFBP-1 levels were increased at least 5 fold compared with control cells. B. Immunoblot analysis of IGFBP-1 levels in the concentrated conditioned media from RTEF-1 o/e HMEC-1 cells. C. QPCR analysis of RTEF-1 and IGFBP-1 levels in HMEC-1 cells treated with either 1 of 2 targeting siRNAs to RTEF-1 or nontarget control siRNAs. D. QPCR analysis of RTEF-1 and IGFBP-1 levels in HMEC-1 cells treated with or without insulin (ng/ml). E. QPCR analysis of RTEF-1 levels in HUVEC cells treated with increasing insulin concentrations. F. QPCR analysis of RTEF-1 levels in HMEC-1 cells treated with RTEF-1 siRNA or nontarget control siRNAs with or without 100 ng/ml insulin. These results are from three independent experiments (mean ± S.D.). * p ≤0.05; ** p≤ 0.01.

