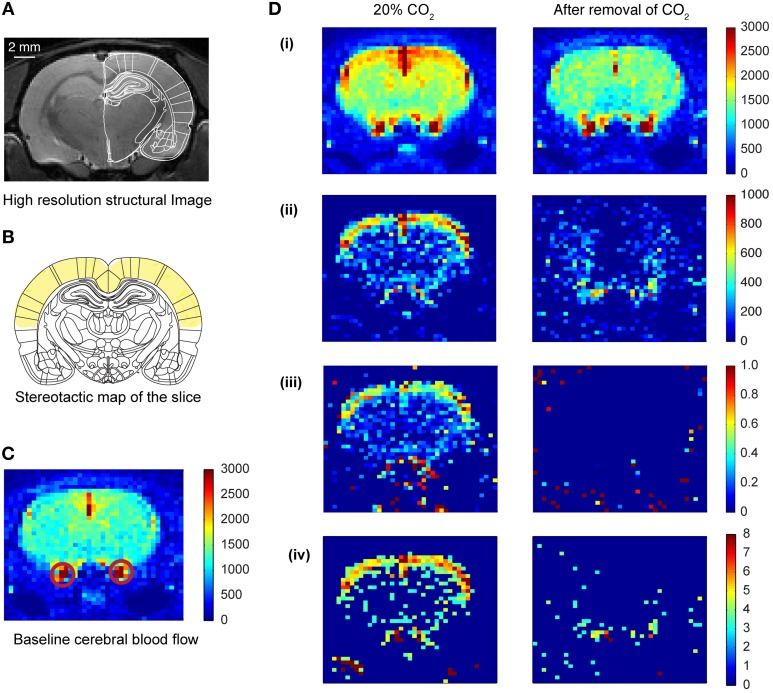
Figure 2.
Cerebral blood flow (CBF) pattern caused by inhalation of CO2. (A) High resolution structural image of the slice acquired prior to CO2 inhalation. (B) Coronal plate from “The rat brain in stereotaxic coordinates” (Paxinos and Watson, 2005). Plate coordinates: −3.0 mm from bregma. All the imaging was done in the corresponding coronal slice plane. The region marked in yellow color represents mainly the motor cortex and somatosensory cortex. (C) Baseline CBF before the inhalation of CO2 of one of the animals. The colorbar represents the intensity of signal in a.u., which is directly proportional to regional cerebral blood volume (rCBV). The red circles show the carotid artery. (D) Transient CBF pattern caused by the inhalation of CO2. (i) The CBF during 20% CO2 inhalation and after removal of CO2. The colorbar represents values in a.u., which is directly proportional to rCBV. (ii) Subtracted images (activation—baseline) showing increased CBF only. (iii) Increase in CBF normalized to the baseline CBF. (iv) Z-score pixel wise (only pixels having z-score above 3 are represented here).

