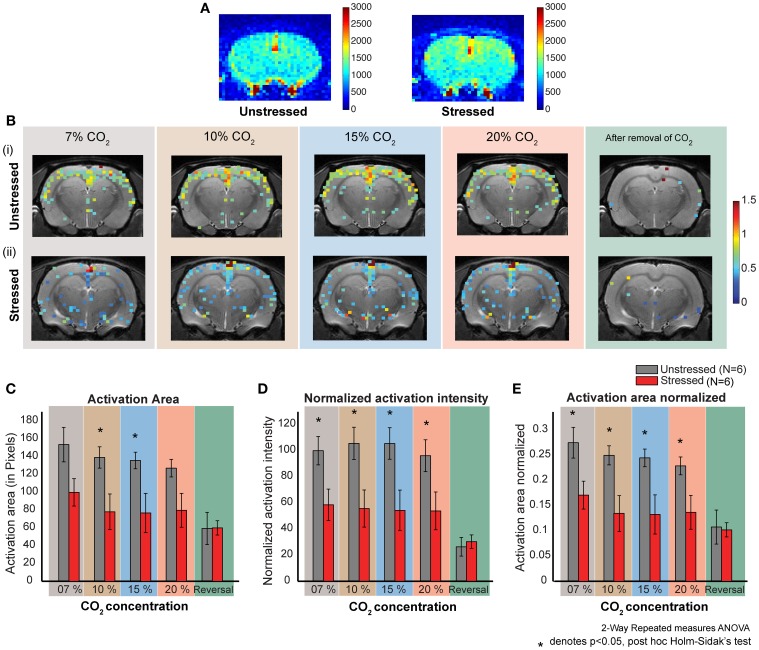
Figure 3.
CO2 induced dose dependent CBF in stressed and unstressed animals. (A) Baseline CBF before the inhalation of CO2. The left image is from an unstressed animal and the right is from a stressed animal. The colorbar represents the intensity of signal in a.u., which is directly proportional to regional cerebral blood volume (rCBV). (B) Dose dependent response to CO2 inhalation. Each image represents the activation (increase in CBF normalized to the baseline) due to the inhalation of indicated percentage of CO2. (i) Represents images from an unstressed animal. (ii) Represents images from a stressed animal. (C–E) Quantification of response to CO2 inhalation in unstressed (N = 6) and stressed (N = 6) animals. (D) Normalized activation intensity (which is directly proportional to increase in cerebral blood flow normalized to baseline cerebral blood flow) in response to CO2 inhalation. There is a significant effect of stress (p = 0.0261) and CO2 inhalation (p < 0.0001). The response of unstressed and stressed rats is significantly different for all the concentrations CO2. (C) Activation area in response to CO2 inhalation. There is a significant effect of stress (p = 0.0404) and CO2 inhalation (p < 0.0001). The response of unstressed and stressed rats is significantly different for 10 % and 15% concentrations of CO2. (E) Activation area normalized to the total slice area in response to CO2 inhalation. There is a significant effect of stress (p = 0.0264) and CO2 inhalation (p < 0.0001). The response of unstressed and stressed rats is significantly different for all the concentrations of CO2.

