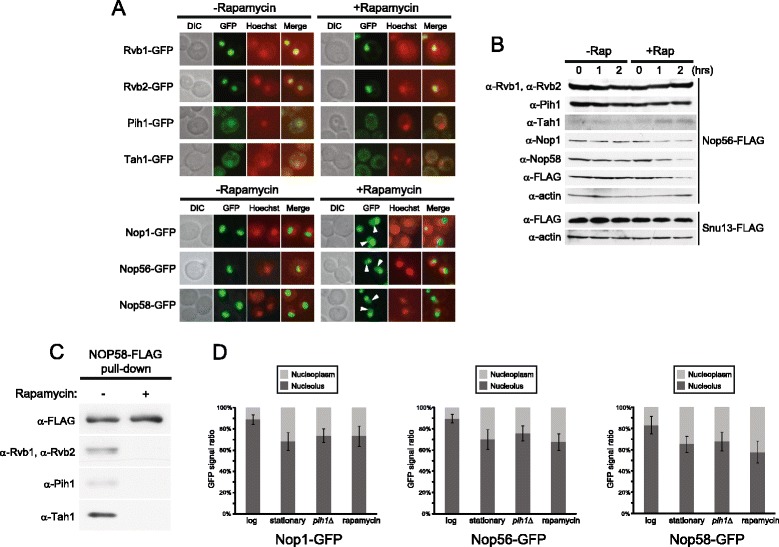
Figure 6.

Effect of different nutrient stresses on the subcellular localization of R2TP and box C/D snoRNP proteins. (A) Subcellular localizations of endogenously GFP-tagged R2TP and box C/D proteins in log phase cells grown in SD medium in the absence or presence of rapamycin. Cells were stained with Hoechst33342 and then analyzed for GFP or Hoechst33342 fluorescence. The images of DIC, GFP (green), and Hoechst33342 (red), and the merged pictures are shown. White arrowheads show nucleoplasmic GFP signals of Nop1-GFP, Nop56-GFP, and Nop58-GFP. (B) Western blot analysis of R2TP and box C/D snoRNP proteins in log phase cells treated or untreated with rapamycin. (C) Western blot of Nop58-FLAG pulldown complex in log phase cells in the absence or presence of rapamycin. (D) Quantification of Nop1-GFP, Nop56-GFP, and Nop58-GFP signals from nucleoli and nucleoplasms. GFP signals of approximately 100 cells of each strain were quantified using NIH ImageJ.
