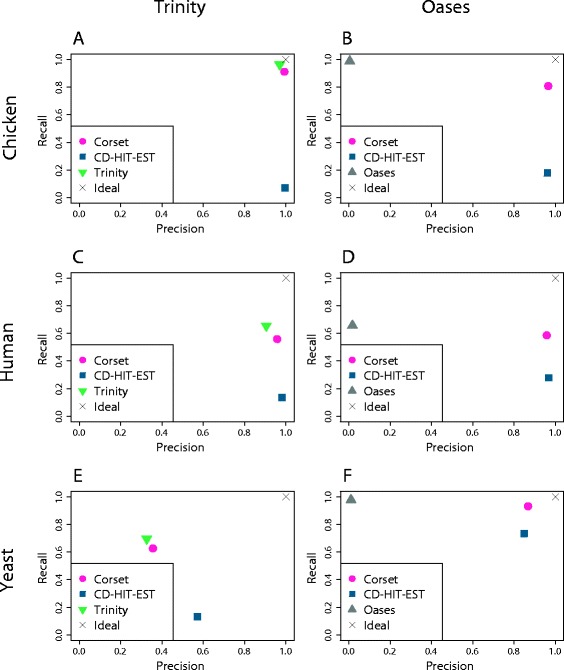
Figure 3.

A comparison of the performance of different clustering approaches. For the assembler’s own clustering (Trinity or Oases), CD-HIT-EST and Corset we show the precision against the recall. The precision is the ratio of true positives over true positives plus false positives and the recall is the ratio of true positives over true positives plus false negatives. We show the results for six different assemblies: (A) chicken data assembled with Trinity; (B) chicken data assembled with Oases; (C) human data assembled with Trinity; (D) human data assembled with Oases; (E) yeast data assembled with Trinity; and (F) yeast data assembled with Oases. The X indicates perfect clustering.
