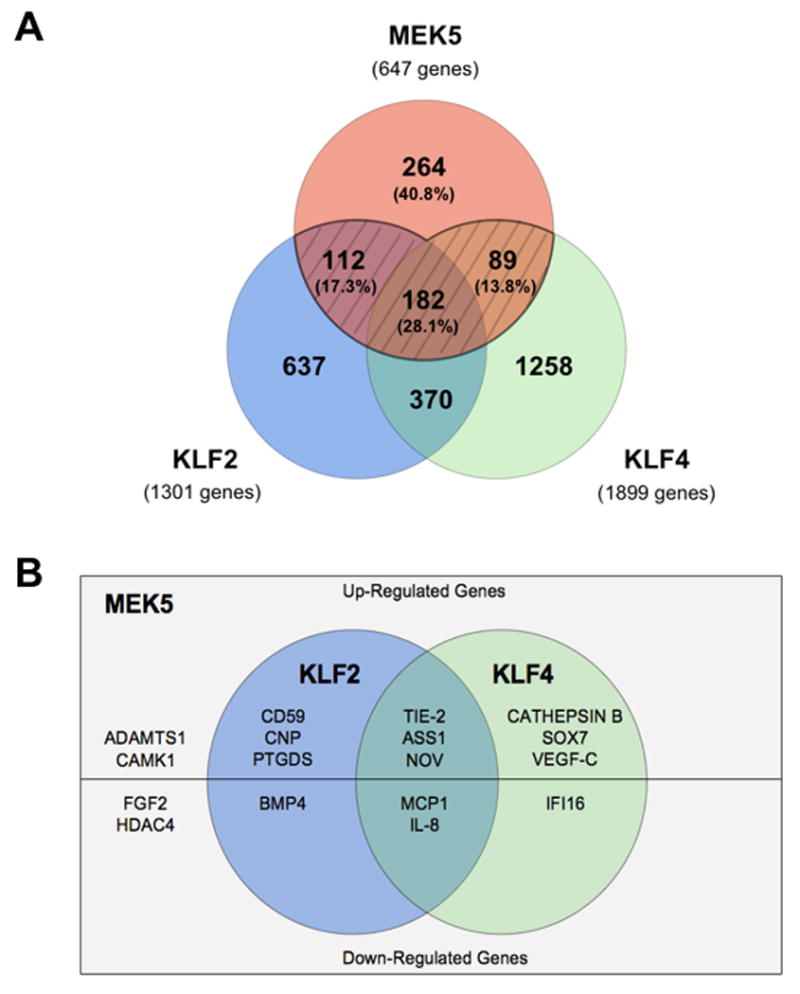
Fig. 3.

Comparative analysis of MEK5, KLF2, and KLF4 global gene regulation. (A) Venn diagram demonstrating the quantitative overlap between endothelial MEK5, KLF2, and KLF4-regulated genes. Percentages represent the proportion of all MEK5-controlled genes present in that particular sector. (B) MEK5-regulatory gene domain highlighting specific KLF2 and KLF4 targets contained within this domain.
