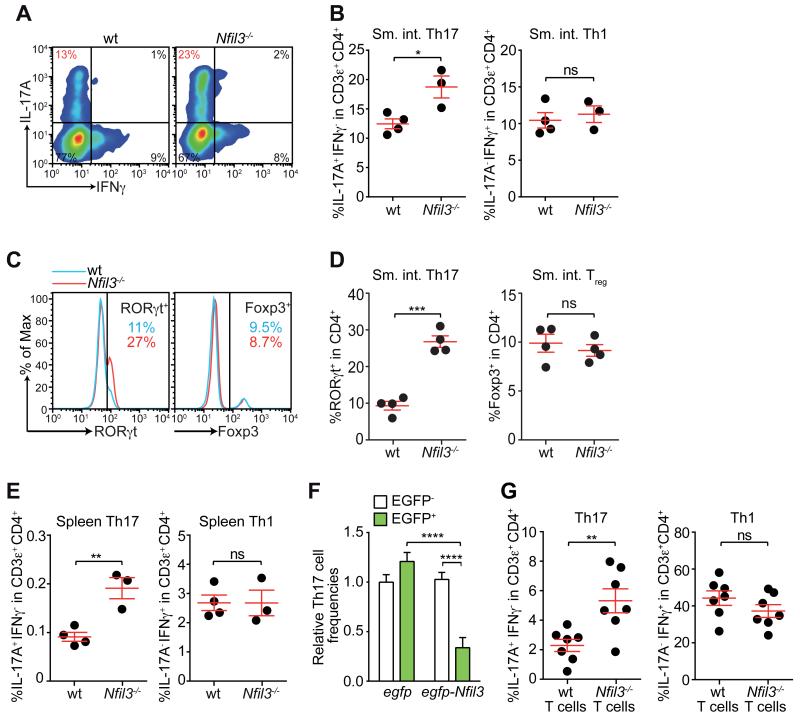
Figure 1. NFIL3 suppresses Th17 cell development in a T cell-intrinsic manner.
Intestinal Th17 cell frequencies were analyzed in wild-type (wt) and Nfil3−/− mice by intracellular staining of IL-17A and IFNγ (A,B) and nuclear staining of RORγt and Foxp3 (C,D). Representative flow cytometry plots are shown in (A) and (C) and combined data from multiple mice are shown in (B) and (D). (E) Splenic Th17 and Th1 cell frequencies in wild-type and Nfil3−/− mice. (F) Naïve wild-type CD4+ T cells were transduced by lentivirus encoding EGFP only or EGFP-tagged NFIL3, followed by culture under Th17-polarizing conditions. Th17 cell frequencies were compared between transduced (EGFP+) and non-transduced (EGFP−) cell populations in the same well. (G) Naïve wild-type and Nfil3−/− CD4+ T cells were transferred intravenously into Rag1−/− mice and LPLs were analyzed 4 weeks later. Data are from two independent experiments. Groups were plotted as mean ± SEM and compared by two-tailed student’s t-test (B, D, E, H) or one-way ANOVA (F). *,p<0.05; **,p<0.01; ***, p<0.001; ****,p<0.0001; ns, not significant.

