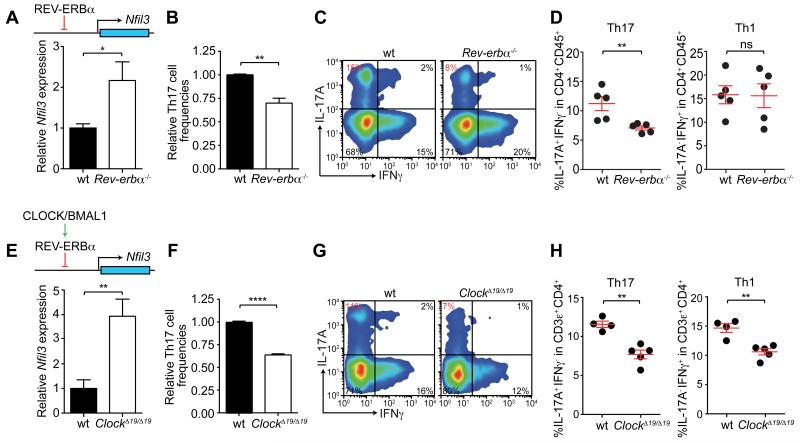
Figure 3. Th17 cell development is regulated by the circadian clock transcriptional network.
(A) Nfil3 expression levels were quantified in activated CD4+ T cells by real-time PCR. (B) Naïve wild-type and Rev-erbα−/− CD4+ T cells were polarized to Th17 cells in vitro. (C,D) Small intestinal Th17 cell frequencies in wild-type and Rev-erbα−/− mice. Representative flow cytometry plots are shown in (C) and combined data are shown in (D). (E) Nfil3 expression in activated wild-type and ClockΔ19/Δ19 CD4+ T cells. (F) Naïve wild-type and ClockΔ19/Δ19 CD4+ T cells were cultured under Th17-polarizing conditions. (G,H) Small intestinal Th17 cell frequencies of wild-type and ClockΔ19/Δ19 mice. Representative flow cytometry plots are shown in (G) and combined data are shown in (H). Data are plotted as mean ± SEM and statistics were performed with the two-tailed student’s t-test. *,p<0.05; **,p<0.01; ***,p<0.001; ns, not significant.

