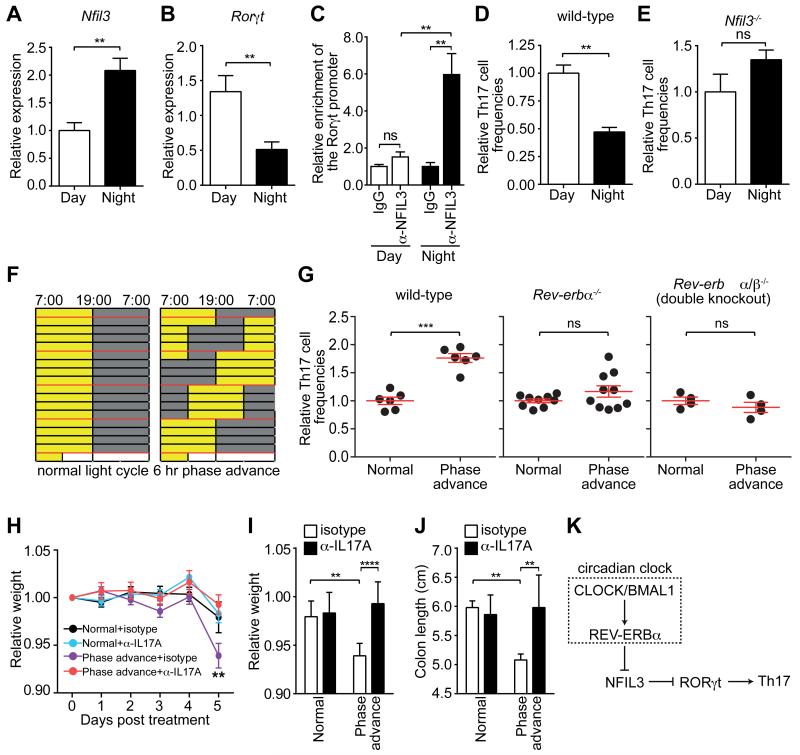
Figure 4. Diurnal regulation of Th17 cell development.
(A) Nfil3 and (B) Rorγt expression in activated CD4+ T cells during the circadian cycle. (C) Diurnal NFIL3 binding to the Rorγt promoter as determined by ChIP assay. (D,E) Relative percentage of IL-17A-producing CD4+ T cells after in vitro polarization of naïve wild-type (D) or Nfil3−/− (E) CD4+ T cells. (F) Wild-type, Rev-erbα−/− or Rev-erbα/β−/− double knockout mice were maintained under a normal light cycle (left) or were subjected to perturbed light cycles (6 hour phase advance every 4 days). Age-matched mice were co-housed prior to the experiment to minimize microbiota differences between mice in each group. (G) Intestinal Th17 cell frequencies in wild-type, Rev-erbα−/−, and Rev-erbα/β−/− mice subjected to light cycle perturbation. Th17 cell frequencies were calculated relative to the age-matched, co-caged controls in each experiment. (H-J) Mouse weight loss during DSS treatment of mice previously subjected to normal or perturbed light cycles. Mice were treated with anti-IL17A or an isotype control along with DSS challenge. Disease severity on Day 5 was assessed by weight loss (H,I) and colon shortening (J). (K) Schematic diagram summarizing how NFIL3 links the circadian clock circuitry to Th17 cell development. Data are plotted as mean ± SEM and statistical analysis was performed with two-tailed student’s t-test (A-E,G) or two-way ANOVA (H-J). *,p<0.05; **,p<0.01; ***,p<0.001; ns, not significant.

