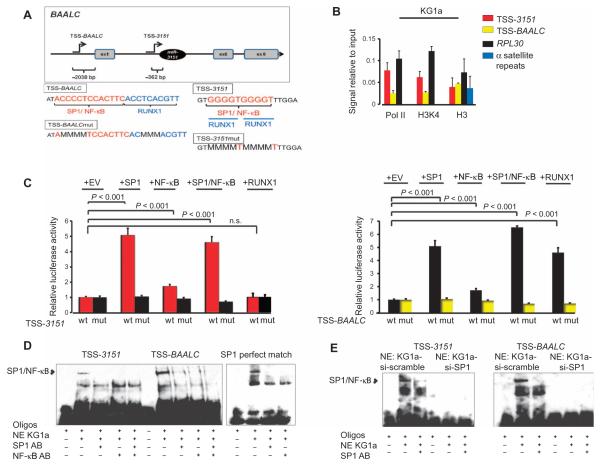
Fig. 6. Upstream regulation of miR-3151 and BAALC.
(A) Top: Predicted transcription start sites for miR-3151 and BAALC, located 362 bp upstream of the stem loop of miR-3151 (TSS-3151) and 2038 bp upstream of the ATG of BAALC (TSS-BAALC), respectively (illustration not drawn to scale). The exons present in the most commonly detected transcript are shown. Bottom: Enlargement of the TSS-BAALC and TSS-3151 regions showing the transcription factor binding sites and the mutated binding sequences. (B) ChIP assays for Pol II, H3K4, and total histone H3 (H3) in KG1a cells. The values of the negative immunoglobulin G (IgG) control did not reach the cycle threshold for any of the primers used and are not depicted in the graph. The amount of immunoprecipitated DNA in each sample is represented as signal relative to the amount of input (mean ± SD, n = 3 biological replicates). (C) Luciferase assays of TSS-3151 or TSS-BAALC with cotransfection of SP1, NF-κB (p65), both SP1 and NF-κB (p65), or RUNX1 in HEK293 cells. A luciferase construct of TSS-3151 or TSS-BAALC with mutated transcription factor binding sites was included as a negative control (mut) (mean ± SD, n = 3 biological replicates; P values were determined using two-tailed Student’s t test). (D) EMSA of TSS-3151, TSS-BAALC, or an SP1 exact match consensus sequence (SPI perfect match). Addition of nuclear extract (NE) from KG1a cells created the expected shift of SP1/NF-κB, which could be abrogated by the addition of antibodies (AB) specific for SP1 or NF-κB. (E) EMSA of TSS-3151 and TSS-BAALC using nuclear extracts from KG1a cells after SP1 knockdown. EMSA data are representative of two independent experiments.

