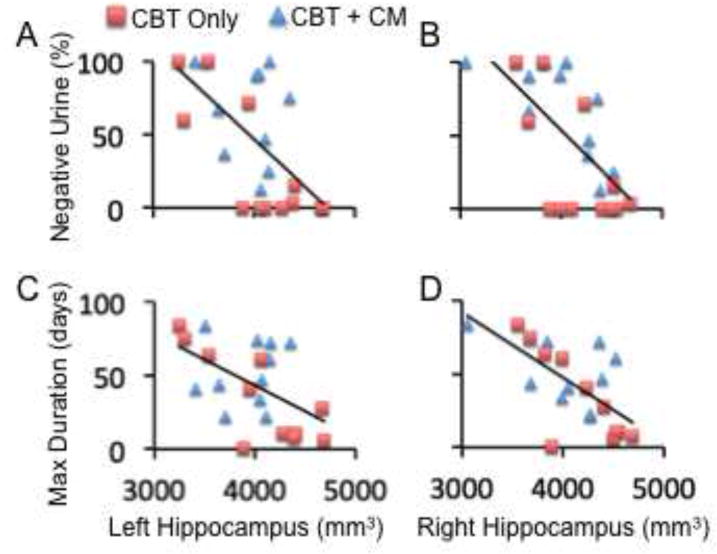
Figure 2.

Correlations between treatment outcomes and volumes of brain structures. A and B: Correlations between percentage of cocaine-negative urine samples during treatment (Y axis) and the volume of the left and right hippocampus (mm3), respectively. C and D: Correlations between the maximum duration (days) of contiguous abstinence from cocaine during treatment (Y axis) and the volume of the left and right hippocampus (mm3), respectively. The red squares and blue triangles represent patients who received “Cognitive Behavioral Therapy (CBT) only” and “CBT + Contingency Management (CM)”, respectively.
