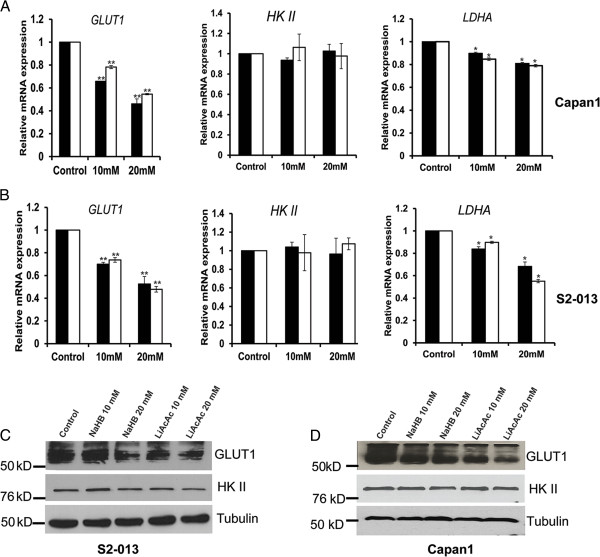
Figure 3.

Ketone bodies repress the expression of key glycolytic enzymes. Relative mRNA expression levels of GLUT1, HKII, and LDHA in Capan1 (A) and S2-013 (B) cells treated with 10- and 20-mM concentrations of NaHB and LiAcAc for 24 h. Total RNA was isolated from NaHB- and LiAcAc-treated as well as control cells, and relative mRNA levels of different genes were determined by performing qRT-PCR. β-Actin was utilized as an internal control. Protein expression of GLUT1 and HKII was determined by immunoblotting the total cell lysates from S2-013 (C) and Capan1 (D) cells treated with 10 and 20 mM NaHB and LiAcAc for 48 h. β-Tubulin was utilized as an internal control. Values shown are mean ± SEM. *P < 0.05; **P < 0.01.
