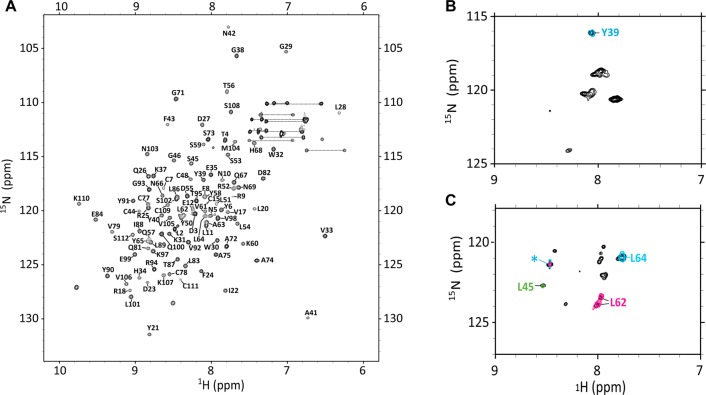
Figure 2.
Assigned 1H–15N HSQC spectra of TGF-β313 and TGF-β131. (A) Assigned HSQC of TGF-β313 with peaks labeled by their one letter amino acid code and residue number. (B) 1H–15N HSQC of 15N-tyrosine selectively labeled TGF-β131 overlaid with the HN plane of HNCO data for Scheme 1 (cyan) labeled TGF-β131. (C) 1H–15N HSQC of 15N-leucine selectively labeled TGF-β131 (black contours) overlaid with the HN plane of an HNCO for Scheme 2 (green contours), Scheme 3 (magenta contours) and Scheme 4 (cyan contours) labeled TGF-β131. Peak labeled with a green asterisk (*) was observed in the HN planes of all HNCO data.

