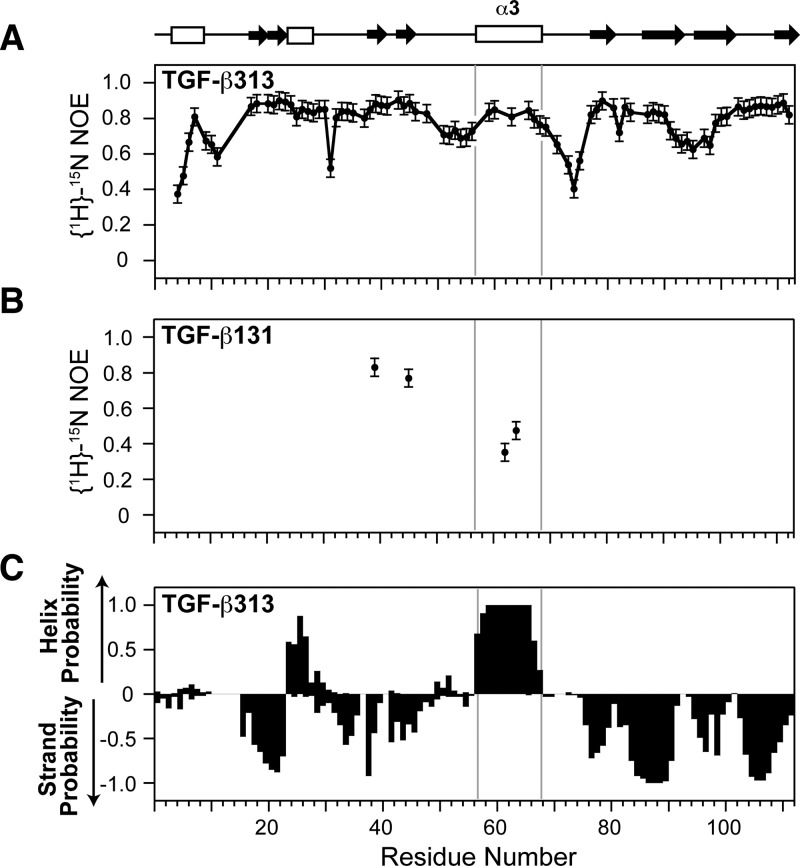
Figure 3.
NMR relaxation and secondary structure analysis of TGF-β313 and TGF-β131. (A) {1H}-15N NOEs of TGF-β313. {1H}-15N NOE values for residues 57, 58, 61 62, 64, and 65 in α-helix 3 region of TGF-β313 could not be accurately measured due to peak overlap. (B) {1H}-15N NOEs of residues Y39, L45, L62, and L64 in TGF-β131. (C) Secondary structure probabilities of TGF-β313 calculated from NMR secondary shifts by the program PECAN;56 positive and negative values indicate α-helical and β-strand probabilities, respectively. Secondary structure diagram shown along the top corresponds to that of TGF-β1 (PDB 1KLC).

