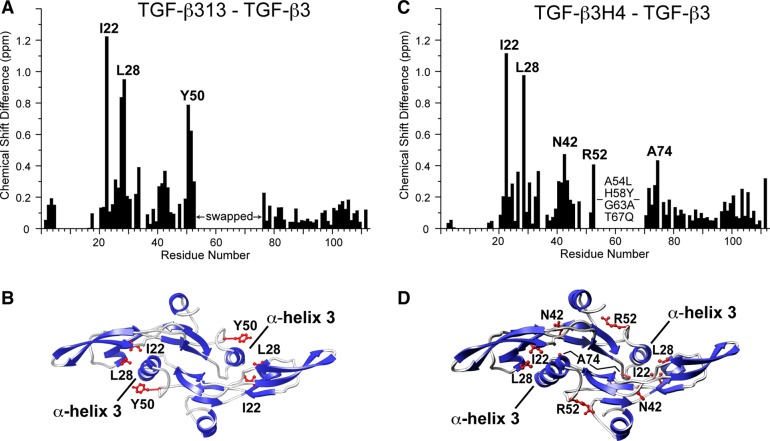
Figure 4.
Chemical shift perturbation between TGF-β3 and TGF-β313 and TGF-β3 and TGF-β3H4. (A, C) Chemical shift perturbation between TGF-β3 and TGF-β313 and TGF-β3 and TGF-β3H4, respectively. Plotted values correspond to the average chemical shift perturbation of 1H and 15N chemical shifts given by Δav = [(Δδ2NH + Δδ2N/25)/2]1/2 between corresponding residues. (B, D) Residues with the largest shift perturbations between TGF-β3 and TGF-β313 and TGF-β3 and TGF-β3H4, respectively, mapped onto the crystal structure of TGF-β3 (PDB code 1TGJ).

