Figure 5.
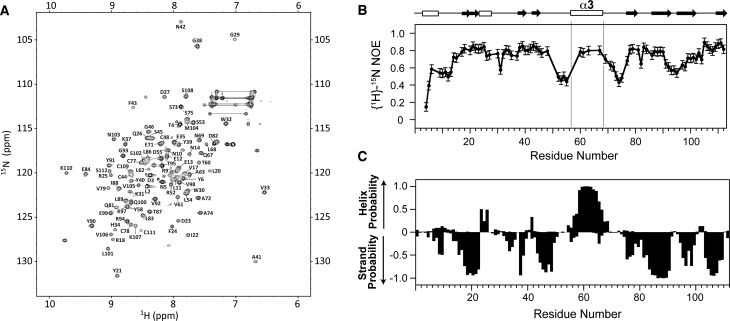
Resonance assignment, {1H}-15N NOE measurements, and secondary structure analysis of TGF-β3H4. (A) Assigned 1H–15N HSQC of TGF-β3H4. Assigned peaks are indicated by their one letter amino acid code and residue number. (B) {1H}-15N NOEs for TGF-β3H4. (C) Secondary structure probabilities of TGF-β3H4 calculated from NMR secondary shifts by the program PECAN;56 positive and negative values indicate α-helical and β-strand probabilities, respectively. Secondary structure diagram shown along the top corresponds to that of TGF-β1 (PDB 1KLC).

