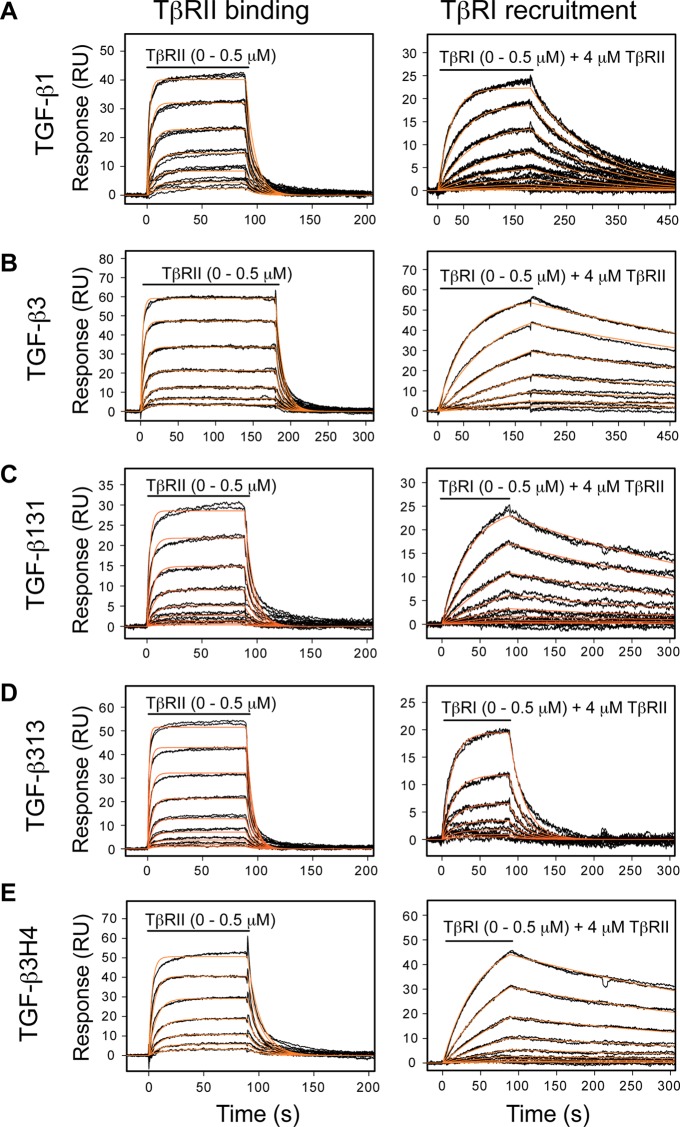
Figure 8.
Quantitative SPR measurements of receptor binding properties with biotinylated TGF-βs. (A) Sensorgrams obtained as TβRII alone was injected (left) or TβRI was injected in the presence of 4 μM TβRII (right) over a TGF-β1 surface. The traces shown (black) correspond to triplicate measurements of a 2-fold serial dilution of the receptor over the concentration range shown. The orange curves correspond to global fits of each data set to a 1:1 binding model. (B–E) Same SPR experiments as in A, except over TGF-β3, TGF-β131, TGF-β313, or TGF-β3H4 surfaces, respectively.

