Figure 5.

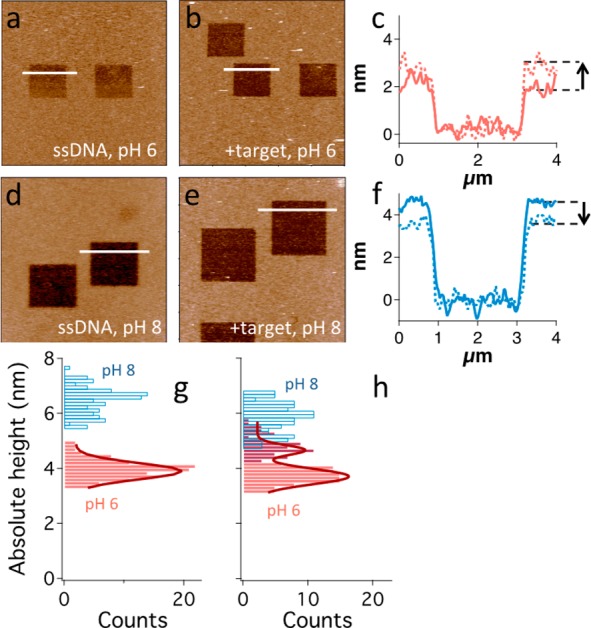
(a–f) Analysis of a representative sample that showcases the monolayer height change related to target binding at different pH values. (a, b, d, e) AFM topography images showing the DNA monolayer (light brown) and the nanografted 2 × 2 μm2 TOEG6 features (dark brown), produced for samples analyzed at pH 6 (a, b) and pH 8 (d, e), before and after target incubation (a, d and b, e, respectively). Images are color-coded in a brighter-is-higher fashion with a scale range of 10 nm. Bars = 4 μm. (c, f) Overlapped height profiles (relative to the TOEG6 layer) obtained for the samples analyzed at pH 6 (a, b, c, red profile) and pH 8 (d, e, f, blue profile). Solid and dashed lines represent SAM height profiles before and after target incubation, respectively. An arrow marks the height increase observed at pH 6 and the decrease at pH 8. (g, h) Absolute DNA height distributions obtained from each nanografted patch at pH 6 and pH 8 are represented in red and blue, respectively. The former are fitted with Gaussian functions (dark red curves). ssDNA SAM height at pH 8 is ∼3 nm higher than at pH 6 (g), and there is no overlapping between the two distributions. Height distribution at pH 6 can be well fitted by a single Gaussian curve. After hybridization with a 10-mer target (h), height distribution at pH 6 changes significantly, and a ∼ 25% higher component (dark red bars) appears from the background, which is centered at a height slightly lower than 4 nm. This distribution was fitted with a double Gaussian curve. pH 8 height distribution shows a less remarkable change, height values becoming ∼10% lower after hybridization. The two height distributions after target incubation clearly overlap for values around 5 nm.
