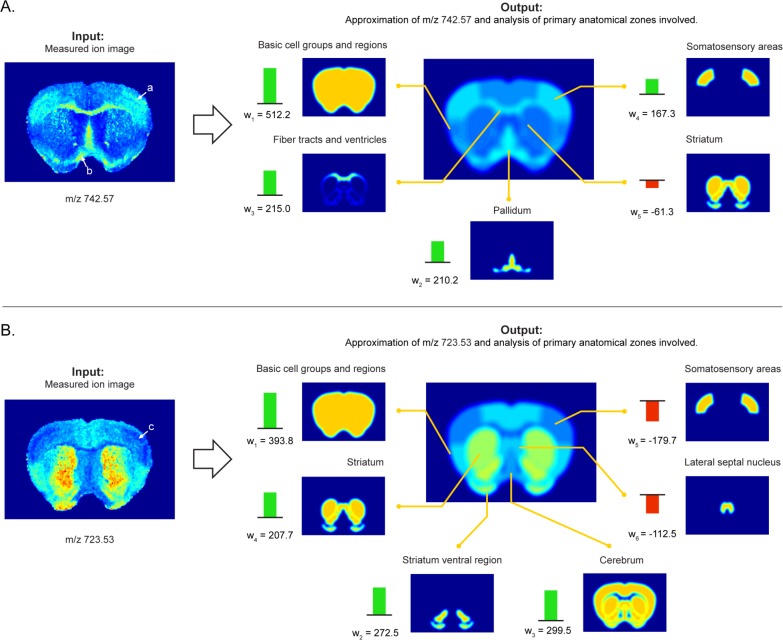
Figure 5.
Examples of automated anatomical interpretation. When an ion image is given as input (left), the interpretation method provides an optimal anatomical explanation for the observed ion pattern (right), using the library of provided anatomical structures. Specifically, the ion intensity pattern is decomposed without user intervention into an optimal combination of contributing anatomical structures from the atlas. The interpretation method provides (i) the closest approximation of the measured ion image using atlas structures (right, middle) and (ii) an overview of the contributing anatomical structures, specifying name, reference location, and contributing intensity or weight in the interpretation (right, outer ring). This visualization delivers quick insight into the major anatomical zones associated with an ion image, while also providing a notion of the relative contributions of each underlying structure involved. Negative weights indicate a relative decrease of the ion in those areas. (A) Ion m/z 742.57 is highly expressed in the somatosensory areas, the fiber tracts, and the pallidum. (B) Ion m/z 723.53 shows a decrease specifically in the somatosensory areas, as indicated by the negative weight. The empirical ion distributions show good congruence with the boundaries of the anatomical structures defined in the atlas, indicating good spatial mapping between the data sources and strong biological signals in the IMS measurements.

