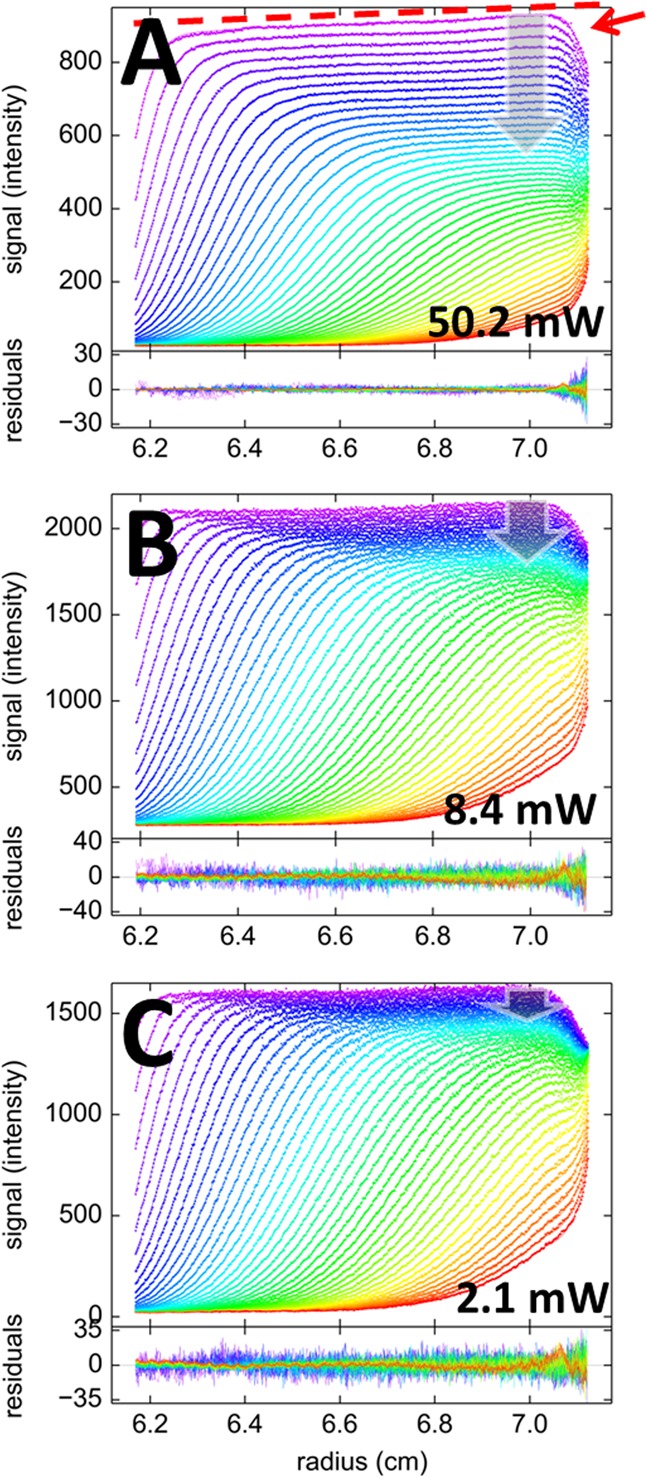
Figure 1.

Sedimentation velocity data of 100 nM Dronpa at 50 000 rpm, with 488 nm excitation at laser power settings of 50.2 mW (A), 8.4 mW (B), and 2.1 mW (C), and emission detected through a standard 505–565 nm bandpass with photomultiplier and gain settings adjusted to keep the signal in an appropriate range. Shown in the upper panels are data points (symbols) and best-fit model (lines) following eq 8 with exponential decay T(t) as in eq 4, with αt = 0; residuals are shown in the lower panels. The color temperature indicates the progression of time, violet for early times and red for late times. Characteristic features of FDS data are a radial gradient of signal intensity, αr, indicated by the dashed red line, and a shadow of the end of the solution column, indicated by the red arrow in panel A. The laser power-dependent temporal modulation of signal T(t) is indicated in all plots as gray vertical arrows, which, for visual reference, highlight the plateau depletion within the first 2.5 h of the sedimentation process. For the 2.1 mW data, the plateau depletion corresponds to solely the geometrically imposed radial dilution.
