
Figure 2.
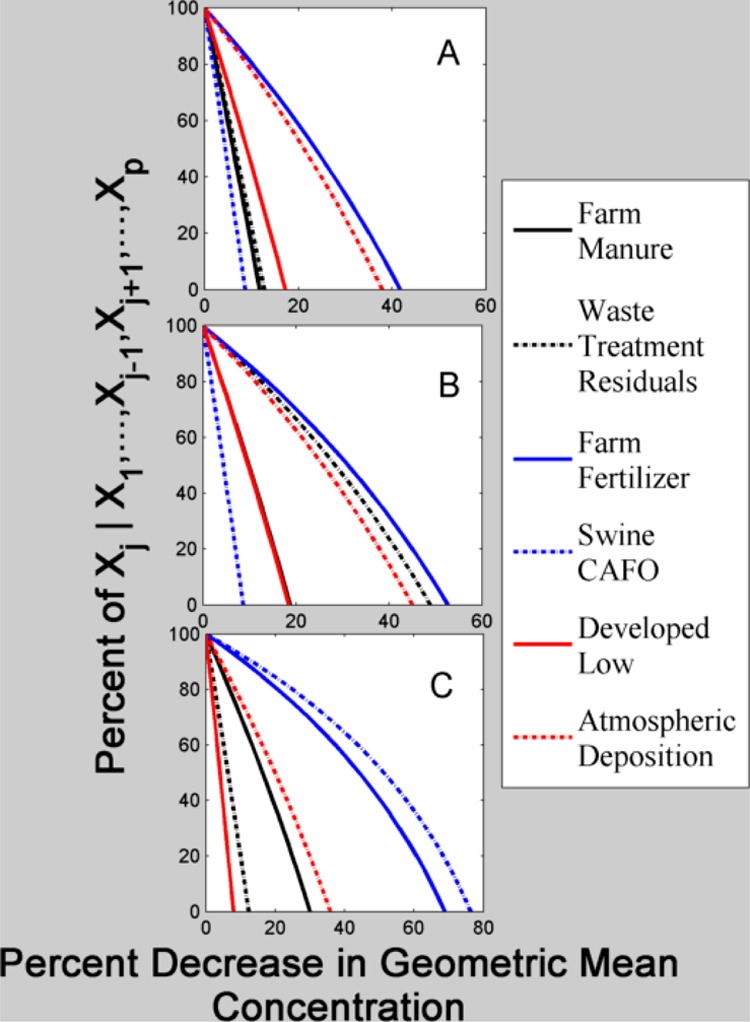
Elasticity curves for monitoring well sources. Y-axis is the percent decrease in a source and the X-axis is the percent decrease in geometric mean, for (A) state-wide, (B) within 1 km of wastewater treatment residuals, and (C) within 1 km of swine CAFO’s.