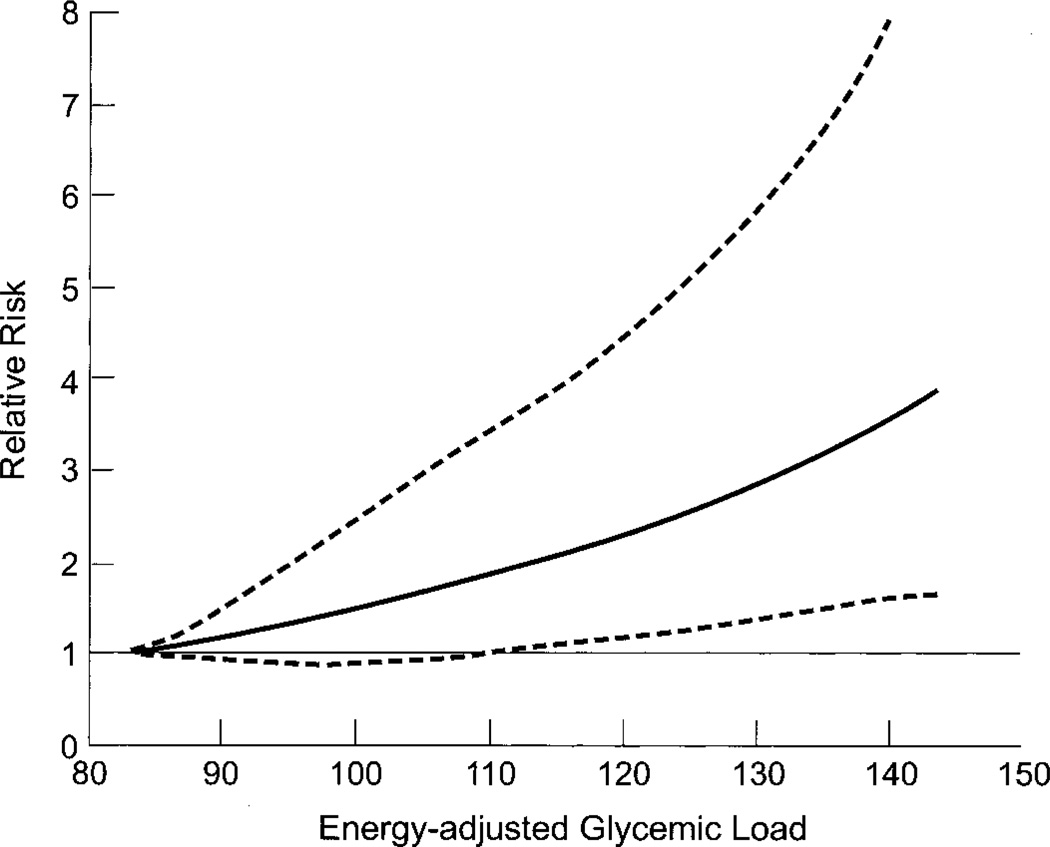
Fig. 1.
Multivariable-adjusted relative risk of colorectal cancer as a function of glycemic load. Data were fit by using a restricted cubic spline Cox proportional hazards model, adjusted for the same covariates as in Table 2. Glycemic load values above the 95th percentile were deleted to make the graph more stable; knots were placed at the 5th, 25th, 75th, and 95th percentiles of the remaining observations. Dotted lines = 95% confidence intervals; solid line = adjusted relative risk of colorectal cancer as a function of glycemic load.

