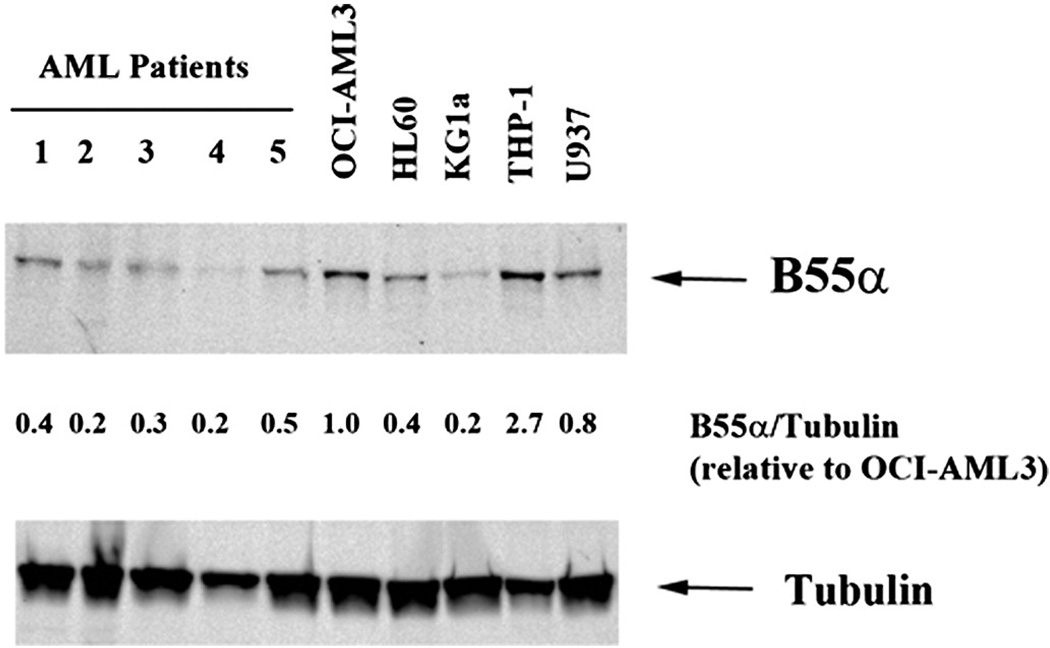
Fig. 2.
Expression of B55α in AML primary cells and cell lines. Protein lysate (200,000 cell equivalents) from five primary AML patient blast cells and five AML cell lines including OCI-AML3, HL60, KG1a, THP-1, and U937 was subject to SDS/PAGE and Western blot analysis performed for B55α and Tubulin. Ratio of B55α to Tubulin was determined by densitometric analysis of the bands depicted in the figure.

