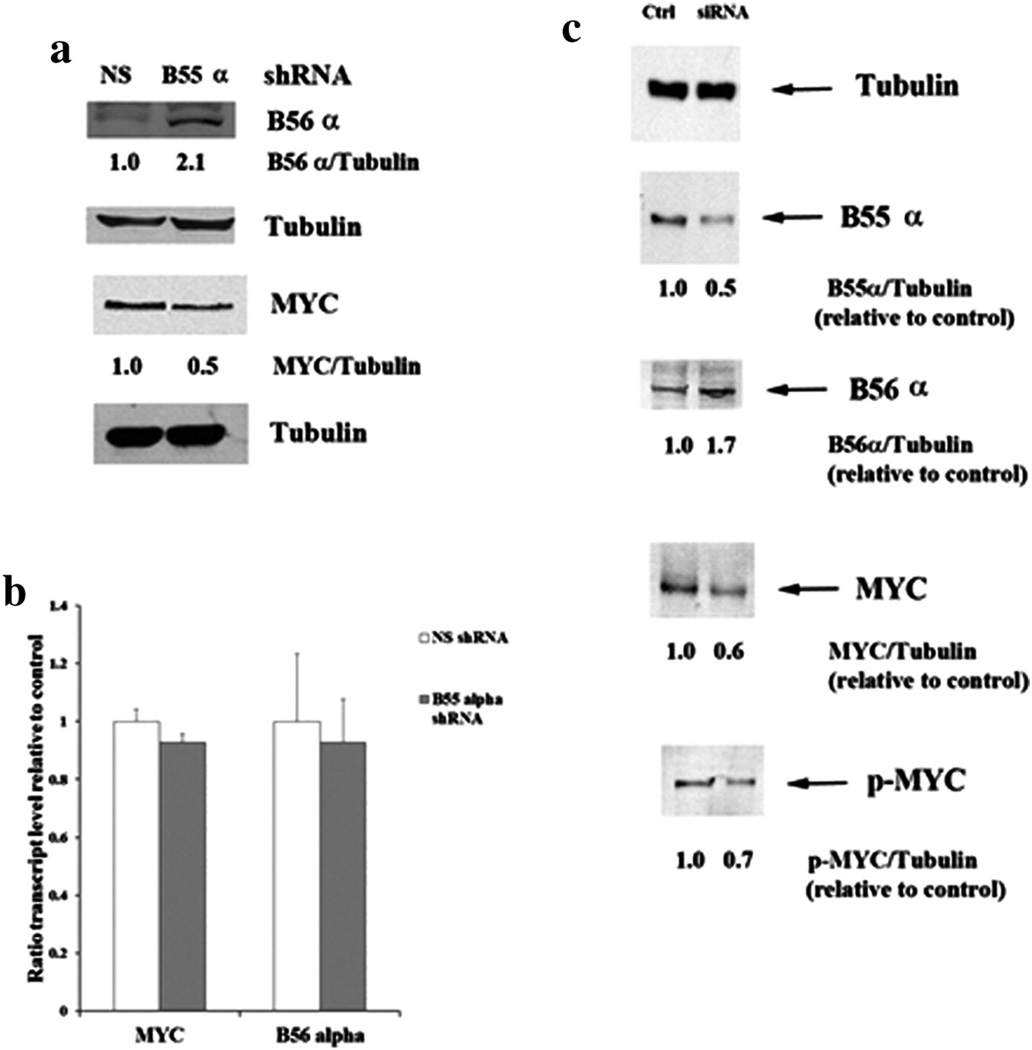
Fig. 6.
Effect of B55α suppression on MYC and B56 α in OCI-AML3 cells. (a) Protein lysate (200,000 cell equivalents) from OCI-AML3 cells containing control (NS) lentiviral plasmid or cells containing B55α shRNA lentiviral plasmid was subject to SDS/PAGE and Western blot analysis performed for B56α, MYC, and Tubulin. Ratios were determined by densitometric analysis of the bands depicted in the figure. (b) RNA was isolated from OCI-AML3 cells containing control (NS) lentiviral plasmid or cells containing B55α shRNA lentiviral plasmid. Gene expression was determined by qRT-PCR using ABI assay primers for MYC, B56α, and 18S RNA as described in the “Materials and methods”. The Student t-test was performed to determine statistical significance (p > 0.05 in all cases). (c) Protein lysate (200,000 cell equivalents) from OCI-AML3 cells treated with control siRNA or B55α siRNA was subject to SDS/PAGE and Western blot analysis performed for B55α, B56α, MYC, p-MYC, and Tubulin. Ratios were determined by densitometric analysis of the bands depicted in the figure.

