
Figure 1.
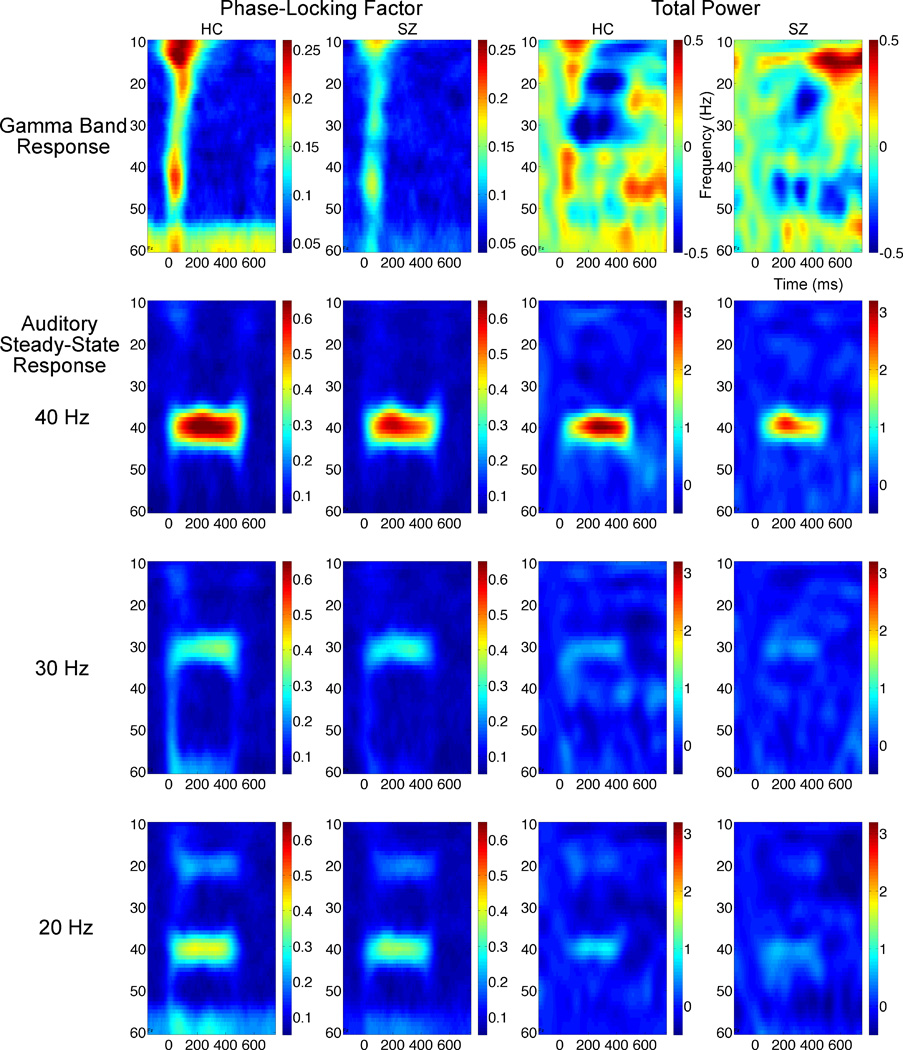
Grand average time-frequency maps from 25 healthy controls (HC) and 28 schizophrenia patients (SZ) are plotted with frequencies on the y-axis and time on the x-axis. Gamma Band Responses are plotted on the top row while Auditory Steady-State Responses for 20, 30, and 40 Hertz (Hz) driving conditions are shown on the second, third, and fourth rows respectively. Dark red colors indicate little phase variance across trials in the first two columns, whereas dark blue colors indicate equally distributed phase variance across trials. In the third and fourth columns, total power data are plotted in deciBel units, with dark red and blue showing magnitude increases or decreases relative to a 100 millisecond baseline.