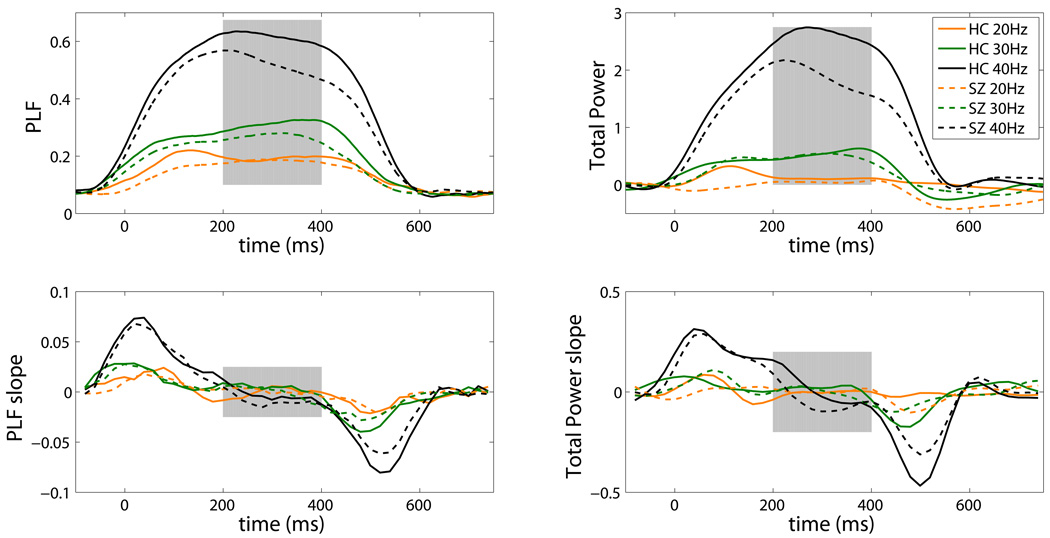
Figure 2.
Healthy control (HC, solid lines) and schizophrenia (SZ, dashed lines) group mean time-frequency data for 40 Hertz (Hz) (black), 30 Hz (green) and 20 Hz (orange) driving conditions are plotted for Phase-locking Factor (PLF) (left), and total power (right) measures on the top row. The rate of change (i.e. slope) in 20 millesecond (ms) increments from each measure in all conditions are plotted on the bottom row. All values are based on the group average taken in bands ±2Hz around the stimulated frequency. Gray shading between 200 and 400 ms highlights the period of the auditory steady-state response with greatest stability across all conditions, groups, and measures.

