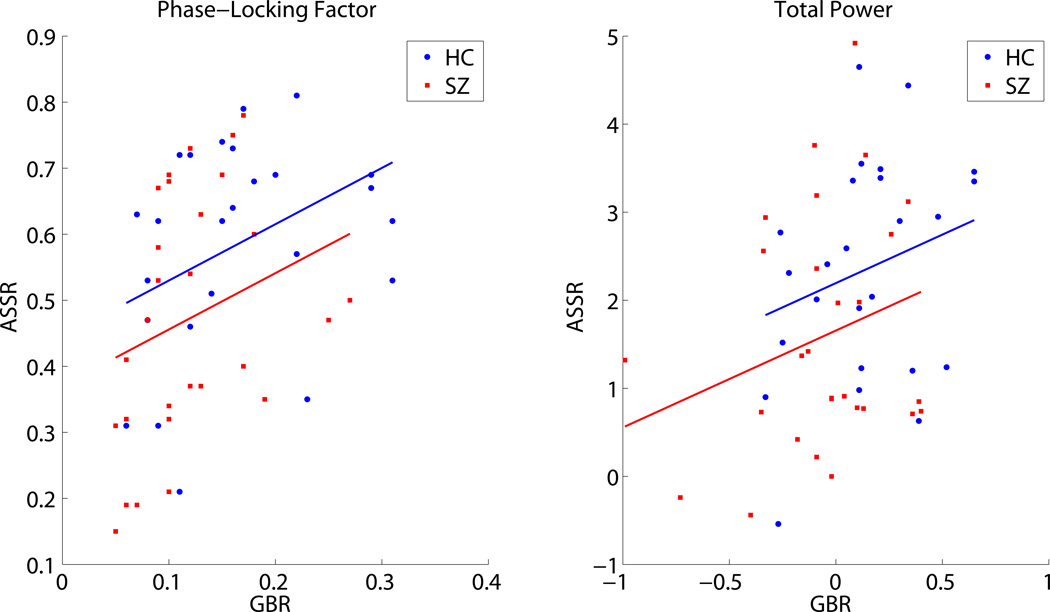
Figure 4.
The relationship between standard tone gamma band response (GBR: x-axis) and 40 Hertz (Hz) auditory steady-state response (ASSR: y-axis) is illustrated with separate scatter plots for phase-locking factor (PLF, left) and total power (right). Each point represents single subject (schizophrenia(SZ): red square; Healthy Control (HC): blue circle) data, averaged across 35–50 Hz and 20–60 milleseconds (ms) for the GBR or across 38–42 Hz and 200–400 ms for the ASSR. Regression lines are plotted separately using the common slope and separate intercepts for each group (SZ: red; HC: blue) to show the relationship between paradigms for PLF (partial r (controlling for Group) = .326, p = .018) and total power (partial r (controlling for Group) = .254, p = .069).

