
Figure 1. Visual representations of trait changes across the KPB.
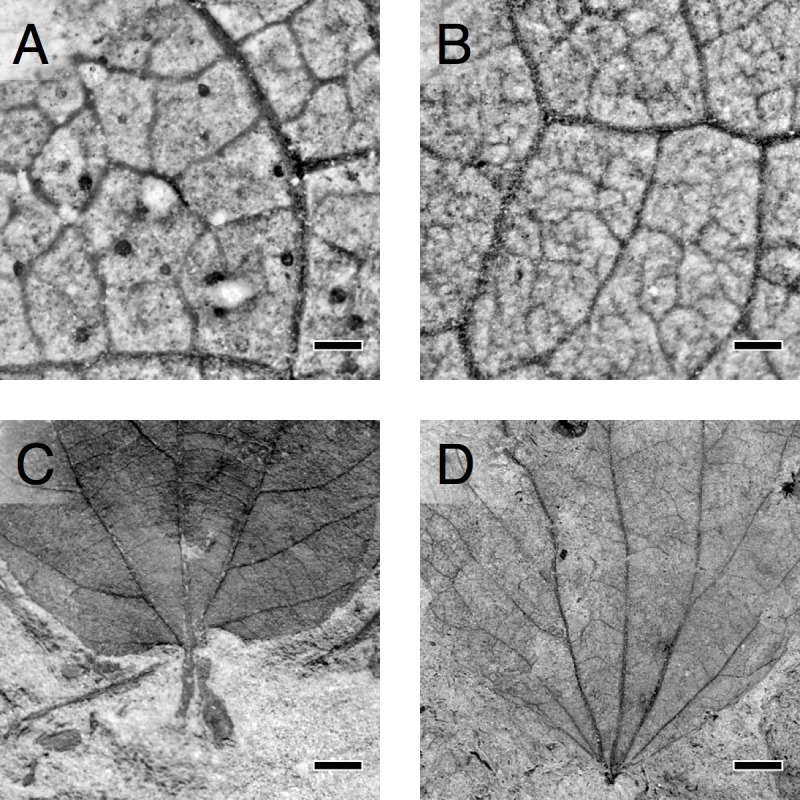
Top row, increase in VD as seen in (A), “Dryophyllum” subfalcatum, −30.7 m stratigraphic depth, VD = 2.5 mm−1 and (B) unknown nonmonocot (morphospecies FU87), 1.275 m depth, VD = 5.3 mm−1. Bottom row, decreases in LMA as seen through decreasing PW for similar LA in (C) “Ficus” planicostata, −3.6 m depth, LMA = 136 g m−2 and (D) “Populus” nebrascensis, 7.2 m depth, LMA = 48 g m−2. Scale bar, (A and B) 500 µm and (C and D), 5 mm.