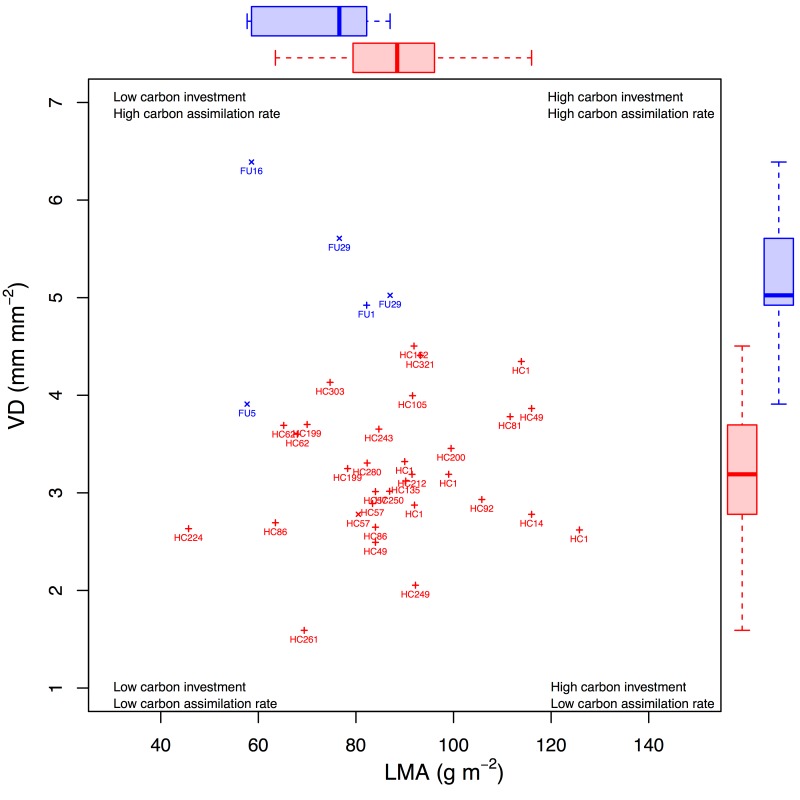
Figure 3. Ecological strategy dynamics across the KPB, as seen in a bivariate trait space of VD and LMA.
Points represent individual specimens for which both VD and LMA measurements were available (labeled by morphospecies). Boxplots of each distribution are shown in the margins. Colors and symbols are as in Figure 2.

