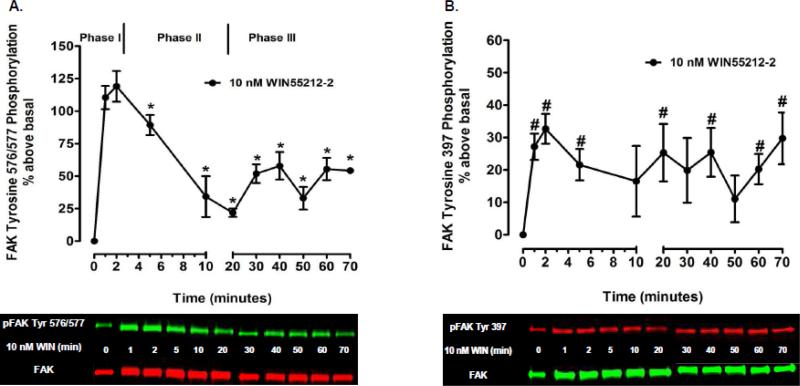
Fig. 1.
Time-course analysis of CB1-stimulated FAK phosphorylation at tyrosines 397 and 576/577 in N18TG2 cells. Cells were treated with 0.01 M WIN55212-2 (WIN) at 37°C for the indicated times. Immunoblot analysis was performed and data are reported as mean ± SEM of the % change over basal (A) pFAK tyrosine 576/577 levels and (B) pFAK tyrosine 397 levels (normalized to total FAK at each time point) from four separate experiments. * indicates significantly different from pFAK tyrosine 576/577 levels at 2 min (p < 0.05 Student's t-test). # indicates significantly different from basal pFAK tyrosine 397 levels at time = 0 (p < 0.05 Student's t-test).

