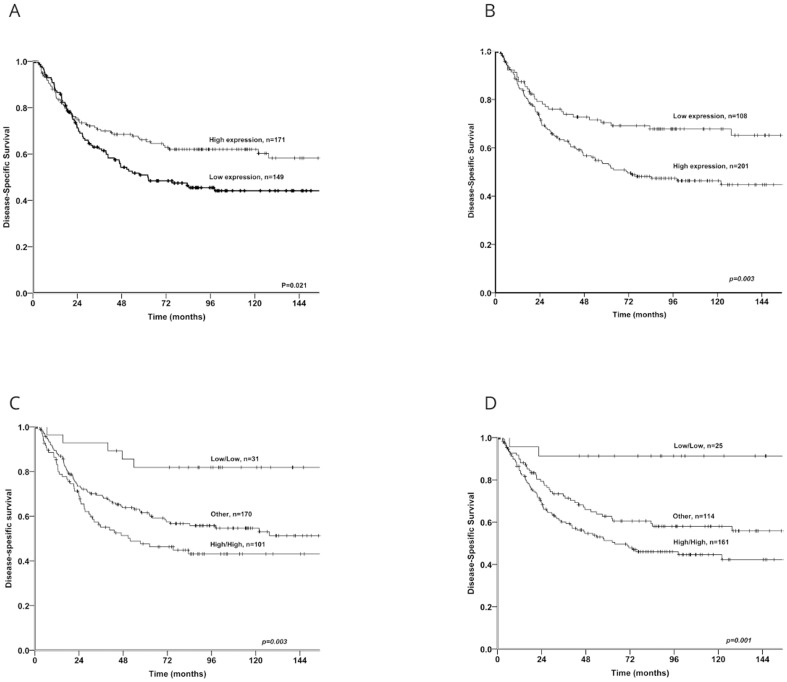
Figure 3. Kaplan Meier curves with DSS for expression of MCT1 and co-expression variables.
Kaplan Meier curves with disease-specific survival for expression of monocarboxylate transporter (MCT)1 in cancer cells and stromal cells and the co-expression variable GLUT1c+MCT4c and GLUT1c+MCT1s in NSCLC. A) MCT1 in cancer cells, B) MCT1 in stromal cells, C) GLUT1c+MCT4c, D) GLUT1c+MCT1s.

